Bitget UEX Daily Report|The US and Iran reach an agreement to reopen the Strait of Hormuz; SpaceX surges 19% on its first day of trading, with a market value exceeding 2 trillion; Asia-Pacific stock markets are strong, with Japan and South Korea leading the gains (June 15, 2026)

 Bitget UEX Daily Report
I. Hot News
Federal Reserve Dynamics
The Federal Reserve is concerned about the pressure on U.S. Treasury yields and the policy path
- The head of trading at Goldman Sachs pointed out that if the 10-year U.S. Treasury yield reaches 5%, it could pose substantial pressure on U.S. stock valuations. Although it has not yet reached this level, volatility in the bond market is increasing.
- Investors are focusing on the upcoming FOMC meeting, where the interest rate path may face repricing.
- Market Impact: Against the backdrop of an AI-driven stock market rally, rising U.S. Treasury yields may suppress risk assets, and in the short term, attention should be paid to the potential drag of the bond market on stock valuations.
International Commodities
The U.S.-Iran agreement eases geopolitical tensions, putting pressure on oil prices
- Trump announced the free opening of the Strait of Hormuz and lifted the blockade. The U.S. and Iran signed a ceasefire memorandum, with a formal ceremony scheduled for June 19 in Switzerland.
- The Israeli airstrike incident drew criticism from Trump, but the overall agreement reduces the risk of escalating conflict.
- Market Impact: The agreement alleviates supply concerns, driving oil prices down, benefiting risk assets but potentially suppressing the energy sector.
Macroeconomic Policy
G7 Summit opens and economic data focus
- The 52nd G7 Summit is being held in France, focusing on global economic coordination.
- Today, the U.S. New York Fed manufacturing index, industrial output, and NAHB housing market index will be released.
- Market Impact: The data and summit outcomes will influence Federal Reserve expectations and market risk appetite, with the current geopolitical easing providing a relatively stable environment for policy discussions.
II. Market Review
Commodity & Forex Performance
- Spot Gold: Approximately $4,300/ounce, +2%.
- Spot Silver: Approximately $70/ounce, +2.8%.
- WTI Crude Oil: Approximately $80/barrel, -4.24%.
- Brent Crude Oil: Approximately $84/barrel, -3.74%.
- U.S. Dollar Index (DXY): Approximately 99.57 points, -0.23%.
Driving Factors Analysis: The U.S.-Iran ceasefire agreement significantly alleviates geopolitical risks, and the expectation of the Strait of Hormuz opening has weakened concerns about oil supply disruptions, leading to a sharp drop in oil prices. Gold and silver benefited from improved risk sentiment and relative stability of the dollar, recording rebounds. The dollar index fluctuated narrowly, reflecting the market's cautious wait for Federal Reserve policy and the balance of geopolitical easing. Overall, inter-asset correlations are evident: reduced geopolitical risk boosts the stock market and cryptocurrencies but suppresses energy prices; gold, as a safe-haven asset, faces short-term pressure but still receives support from industrial and investment demand. Institutional consensus suggests that macro data and G7 outcomes will dominate trends in the short term; if the inflation path is moderate, precious metals are expected to maintain resilience, while oil supply-demand rebalancing will need to focus on the implementation of agreements.
Cryptocurrency Performance
- BTC: Approximately $65,500, +1.2%.
- ETH: Approximately $1,720, +1.9%.
- Total Cryptocurrency Market Cap: Approximately $2.32 trillion, +1.3%.
- Market Liquidation Situation: Total liquidation in 24 hours is approximately $324 million, with short liquidations around $230 million.
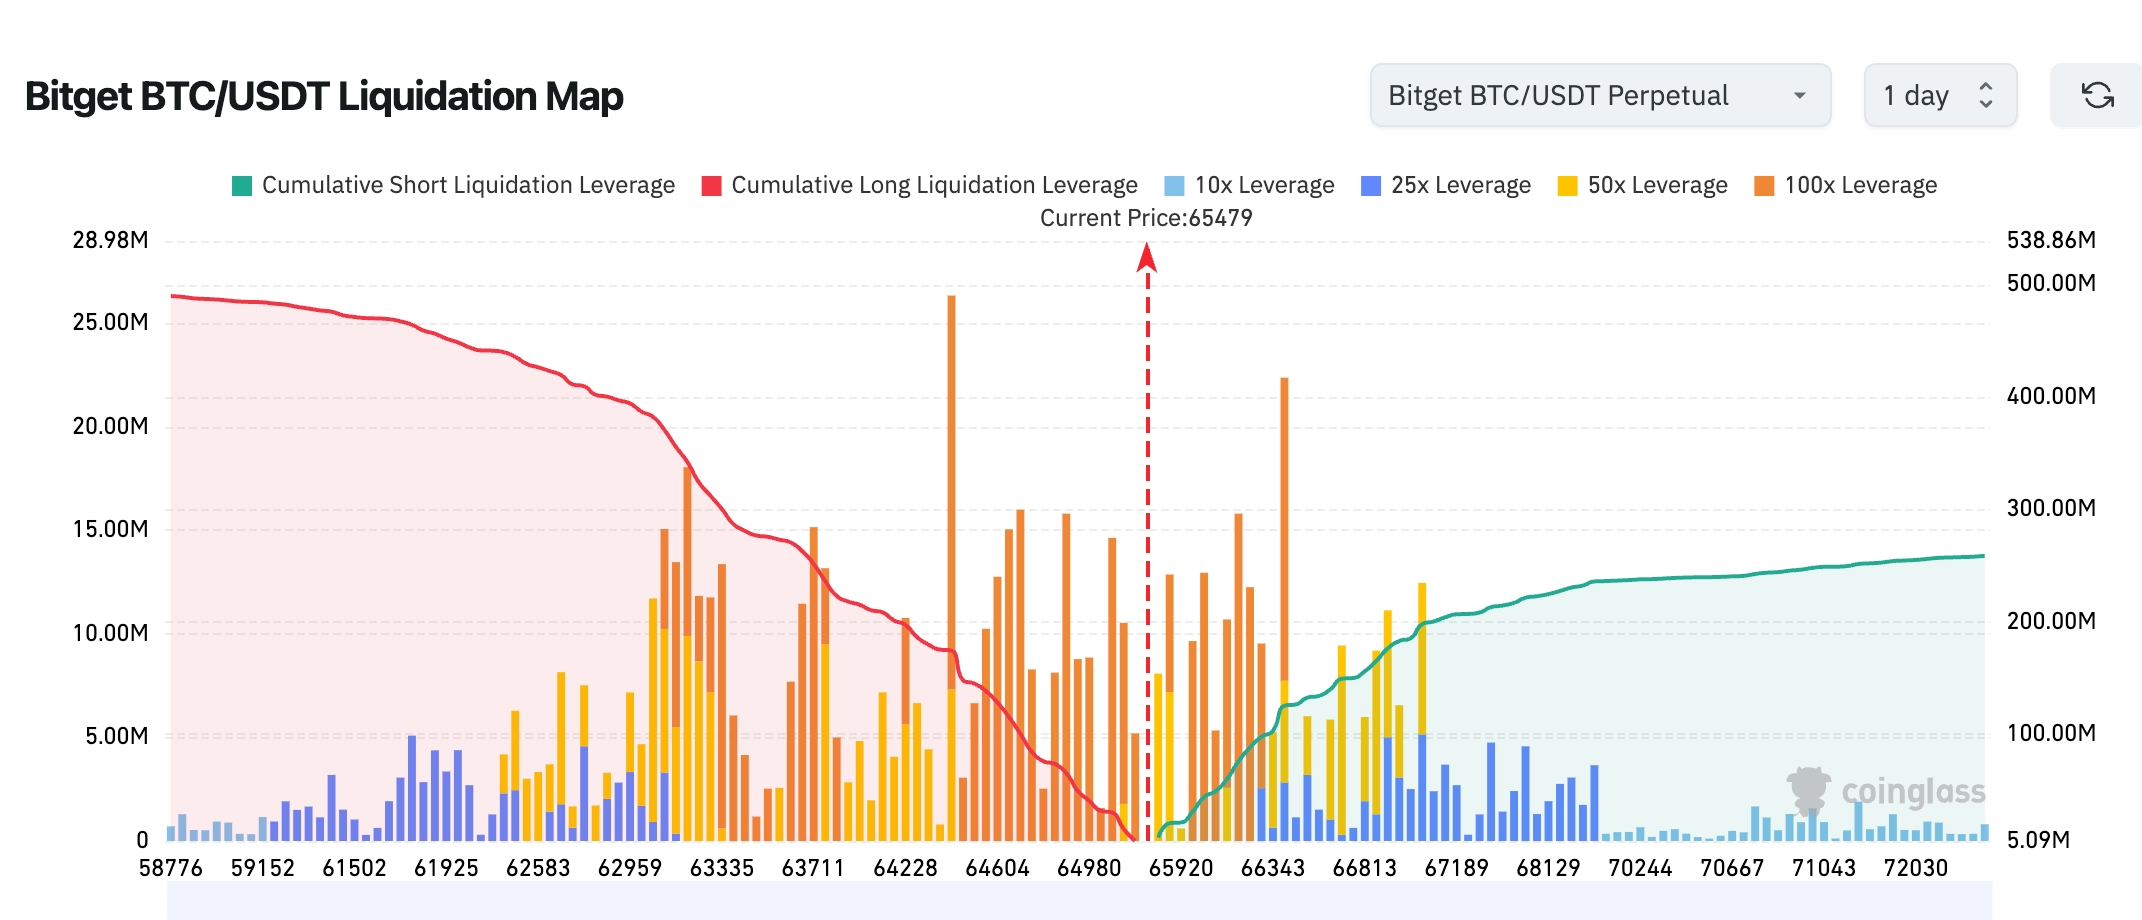
- Bitget BTC/USDT Liquidation Map: Current BTC price is approximately $65,479, with the long liquidation zone around $64,500-65,000 nearly fully released, significantly reducing short-term downward leverage pressure. A large-scale short liquidation is concentrated around $66,300-67,200; if BTC continues to rise and breaks through $66,000, it may trigger short covering, accelerating the price further above $67,000.
- Spot ETF Net Inflow/Outflow: As of last Friday, the BTC spot ETF had a net inflow of approximately $86 million in a single day.
Driving Factors Analysis: The U.S.-Iran agreement eases geopolitical tensions, boosting risk appetite, combined with the successful listing of SpaceX providing a positive catalyst for the crypto market. Both BTC and ETH rebounded, stabilizing total market cap, and ETF funds shifted to a slight net inflow, alleviating previous outflow pressure. Liquidation was primarily in short positions, indicating that shorts were forced to cover, pushing prices upward. Technically, BTC is building a base above $60,000, with institutional views suggesting that improved macro conditions and capital inflows will support short-term trends, but ETH is relatively differentiated, influenced by AI and Layer 2 narratives. Overall, the market has shifted from previous panic to cautious optimism, focusing on the impact of Federal Reserve policies and subsequent macro data on liquidity.
U.S. Stock Index Performance
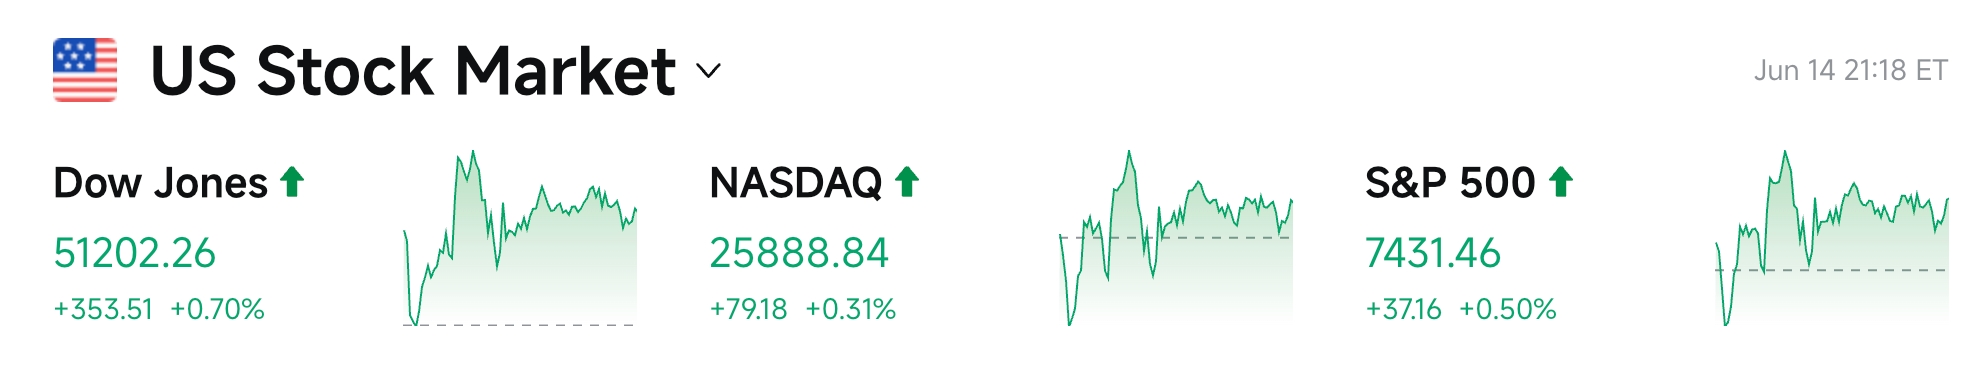
- Dow Jones: Closed at approximately 51,202 points, up 0.7%, continuing the upward trend.
- S&P 500: Closed at approximately 7,431 points, up 0.50%, showing a stable characteristic.
- Nasdaq: Closed at approximately 25,889 points, up 0.31%, driven by technology and semiconductor sectors.
Tech Giants Dynamics
- NVDA: Approximately $205.19, +0.16%.
- AAPL: Approximately $291.13, -1.52%.
- MSFT: Approximately $390.74, +0.10%.
- GOOGL: Approximately $359.68, +0.53%.
- AMZN: Approximately $238.55, -1.23%.
- META: Approximately $566.98, -0.26%.
- TSLA: Approximately $406.43, +1.82%.
Performance Summary and Driving Analysis: The tech giants sector generally strengthened alongside the broader market, with SpaceX's 19% surge on its first day of listing boosting market confidence, and most semiconductors rising (NVDA slightly up). However, some individual stocks showed divergence: TSLA was relatively strong due to positive catalysts, while AAPL and AMZN experienced slight pullbacks. Individual stock divergence is evident: AI-related stocks benefited from valuation expansion, while some consumer tech stocks face valuation pressure or internal adjustments. The events highlighted in the Futu Daily Report underscore the ongoing enthusiasm for space and AI, but caution is warranted regarding the potential impact of rising yields on overvalued stocks.
Overview of Cryptocurrency Stock Derivatives Data
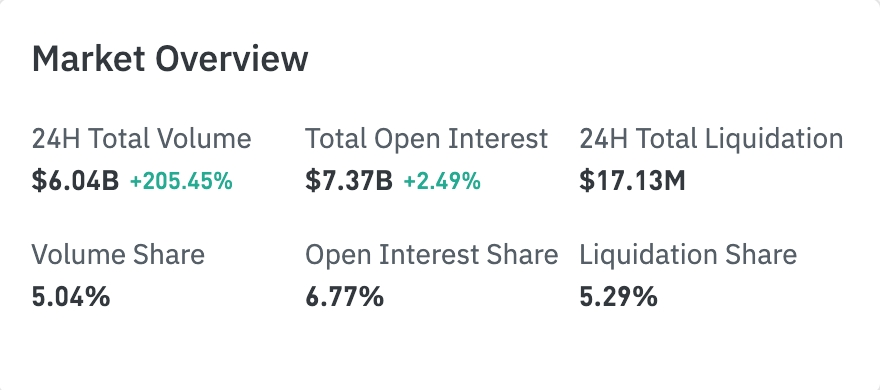
- The stock derivatives market has seen a significant increase in activity, with a total trading volume of $6.033 billion in 24 hours, a surge of 204.94%.
- Total open interest rose to $7.358 billion (+2.39%), indicating continued capital inflow.
- Total liquidation in 24 hours is $17.1293 million, which is relatively controllable against the backdrop of a significant increase in trading volume.
Sector Positioning Performance
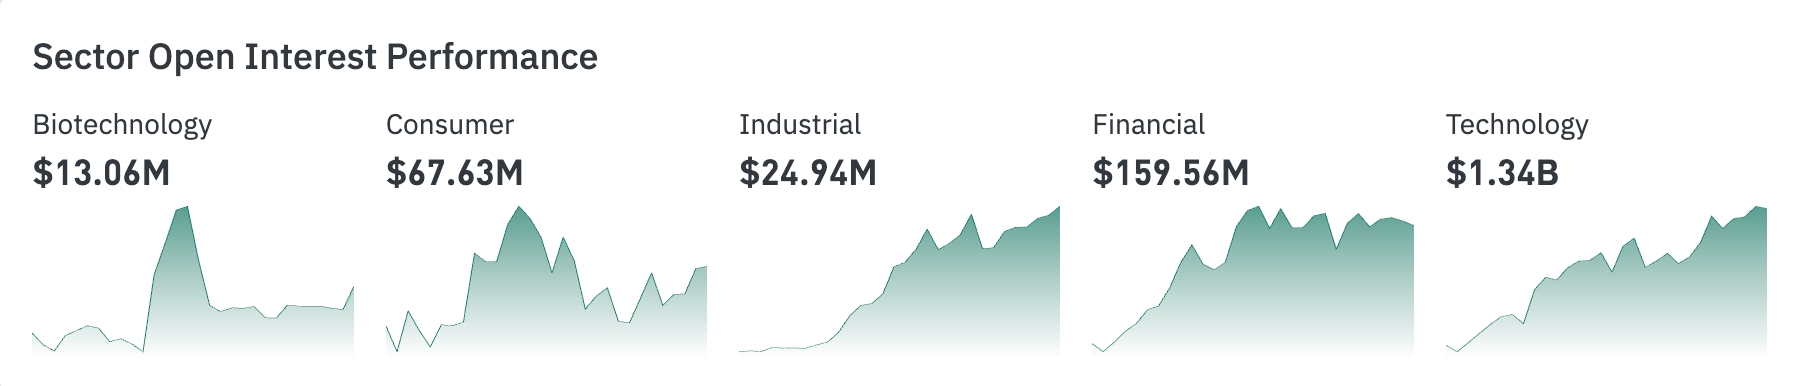
- Technology Sector: Open interest of $1.342 billion, far exceeding other sectors, remains the core trading direction of the market.
- Financial Sector: Open interest of $160 million, ranking second.
- Consumer Sector: Open interest of $67.64 million, significantly ahead of industrial and biotech.
- Industrial ($24.96 million) and biotech ($13.07 million) have relatively low attention.
Heat Map Fund Distribution (by Position)
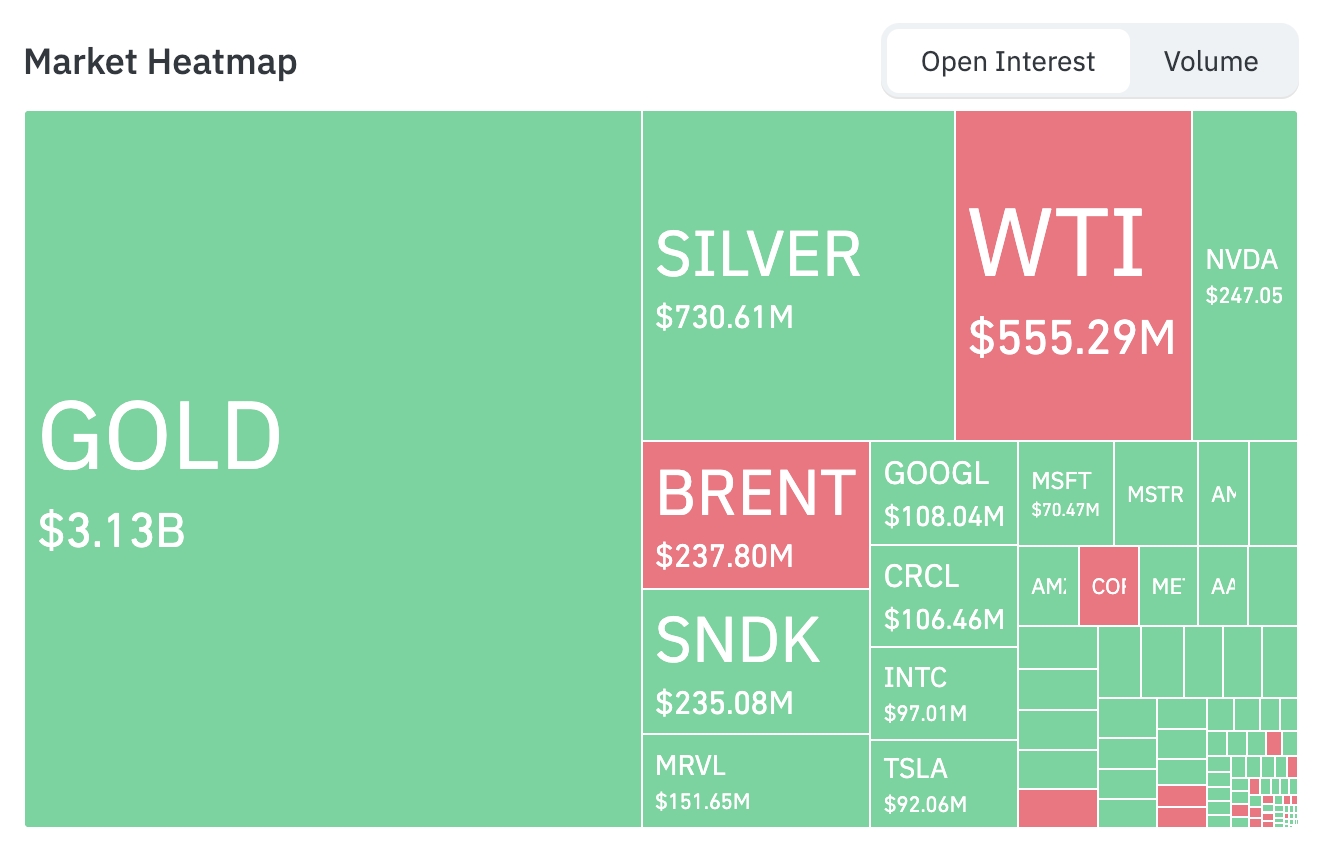
Commodities
- Gold (GOLD) 3.125 billion yuan, the largest holding in the market, with strong demand for safe-haven funds.
- Silver (SILVER) 728 million yuan, ranking second.
- WTI Crude Oil (556 million yuan) and Brent Crude Oil (238 million yuan) have relatively high holdings but are significantly lower than precious metals.
Tech Stocks
- NVIDIA (NVDA) 247 million yuan holds the top position among tech stocks.
- SanDisk (SNDK) 235 million yuan and Marvell Technology (MRVL) 152 million yuan performed well, reflecting continued bets on AI storage and semiconductor chains.
- Google (GOOGL) 108 million yuan and Circle (CRCL) 106 million yuan both exceed 100 million yuan in holdings.
- Intel (INTC) 97.12 million yuan and Tesla (TSLA) 92.07 million yuan maintain high attention.
Sector Movement Observations
Most semiconductor stocks rose, but individual stocks showed significant divergence
- Representative stocks: ARM rose over 11%, Seagate Technology rose over 7%, Intel and Western Digital rose over 6%, SanDisk rose over 5%, AMD and Qualcomm rose over 4%; Micron Technology slightly fell by about 1.4%.
- Driving Factors: Continued demand for AI memory and chips supports the overall performance of the sector, but individual stocks show divergence in fundamentals, influenced by supply chain dynamics, valuation adjustments, and specific company news.
Media/Consumer Tech Sector Movement
- Representative stock: Roku Inc (ROKU) rose about 20%, marking the largest single-day increase since November 2023.
- Driving Factors: Market rumors suggest the company may be in sale negotiations, combined with overall improvement in risk sentiment, driving a strong rebound in stock prices.
Aerospace/Emerging Tech Sector Explosion
- Representative stock: SpaceX (SPCX) surged 19% on its first day of listing, with a trading volume of approximately $80 billion, and its market cap exceeded $2.1 trillion.
- Driving Factors: As a leader in the space sector, its successful listing not only broke IPO records but also boosted investor confidence in high-growth technology sectors, with Cathie Wood's ARK significantly buying in, further amplifying market enthusiasm.
Software Sector Pullback
- Representative stock: Adobe (ADBE) fell 6.7%, marking the worst single-day performance in recent times.
- Driving Factors: The decline is attributed to internal company dynamics or market concerns about the sustainability of growth in software stocks, highlighting divergence within the sector.
III. In-Depth Analysis of Individual Stocks
1. SpaceX (SPCX) - Debut Listing
Event Overview: SpaceX officially debuted on Nasdaq, opening above the $135 issue price, with relatively stable intraday fluctuations, ultimately closing up 19% at around $161, quickly pushing its market cap above $2.1 trillion, making it the sixth largest publicly traded company in the U.S. Trading volume exceeded 500 million shares, with a transaction value of approximately $80 billion, breaking multiple IPO records. Cathie Wood's ARK Invest purchased about 3.29 million shares through private channels, totaling approximately $443 million, making SpaceX its largest holding in the Venture Fund. Options trading will start next week, further enhancing market liquidity and the richness of hedging tools. The previously estimated valuation of nearly $2 trillion for the massive fundraising (approximately $75 billion) further expanded post-IPO, highlighting strong investor confidence in the long-term prospects of the space economy. Market Interpretation: Wall Street institutions generally view SpaceX favorably as a leader in space exploration and satellite internet, with its technological barriers and commercialization potential seen as long-term growth engines, despite its high valuation. The smooth landing of the listing also alleviated market concerns about liquidity shocks that could arise from a surge of large IPOs. Investment Insights: SpaceX's listing sets a benchmark for emerging technology sectors, with short-term demonstration effects likely spilling over to related industry chains, but caution is warranted regarding profit-taking pressure under high valuations. It is recommended to focus on subsequent earnings reports, contract implementations, and options market dynamics as references for entry timing.
2. Adobe (ADBE) - Stock Price Plummets
Event Overview: Adobe's stock fell 6.7% in a single day, marking its worst performance since March, with high trading activity. The market links this to recent company dynamics and overall valuation pressures in the software industry. Although no single event dominated, the defensively weaker software sector faces adjustments amid the overall rotation of tech stocks. Market Interpretation: Analysts believe that under the enthusiasm for AI investments, some traditional software giants' valuations have detached from fundamentals, leading investors to question the sustainability of growth and capital return efficiency. As a leader in creative software, Adobe continues to invest in AI feature integration, but short-term cost pressures and intensified competition have led to cautious market sentiment. Investment Insights: Short-term volatility provides an observation window; it is recommended to closely track the next quarter's AI product monetization data and management guidance. If fundamentals stabilize, it could be seen as a mid-term layout opportunity.
3. Roku (ROKU) - Strong Rebound
Event Overview: Roku's stock surged about 20%, marking the largest single-day increase since November 2023, accompanied by a significant increase in trading volume. Market rumors suggest the company is in potential sale or strategic transaction negotiations, combined with overall improvement in risk appetite, driving the stock price quickly away from recent lows. Market Interpretation: Institutional views suggest that Roku, as a key infrastructure provider for streaming platforms, has attractive moats in advertising and content distribution, especially under expectations of consumer recovery, making potential acquisition premiums an important catalyst. Investment Insights: Event-driven trading is suitable for short-term operations, but caution is warranted regarding the risk of rumors being disproven. Attention should be paid to subsequent official statements and industry consolidation progress.
4. Sivers Semiconductors (SIVE) - AI Optical Collaboration Boost
Event Overview: Sivers Semiconductors recently deepened its silicon photonics collaboration with GlobalFoundries, developing co-packaged and pluggable optical solutions for AI data centers, while also securing approximately $8.2 million in Ka-band beamforming IC production orders from All.Space. Although the company faced a year-on-year revenue decline in Q1 and is experiencing expanded operational losses and cash burn pressures, the order pipeline and strategic alliances have boosted market sentiment, leading to significant stock volatility and a phase rebound. Market Interpretation: Analysts recognize its technical expertise in optical interconnects for AI infrastructure, believing that if capacity expansion and CHIPS Act-related support are implemented, it will significantly improve long-term growth trajectories; however, short-term execution risks and valuation volatility still need to be emphasized. Investment Insights: Suitable for AI supply chain thematic allocation, it is recommended to assess holdings based on order execution progress and monitor potential dual listing developments for liquidity enhancement.
5. AXT Inc. (AXTI) - Indium Phosphide Shortage and AI Demand
Event Overview: AXT Inc.'s stock has experienced significant volatility recently, driven by reports of potential export restrictions on indium phosphide and a surge in material demand for AI data centers, with analysts repeatedly raising target prices. The company is actively expanding capacity, with Q1 performance showing improved gross margins and a backlog of orders reaching $100 million. Despite facing governance issues and financing activities, AI-driven demand prospects remain a core catalyst. Market Interpretation: Institutions believe that AXT's supply position in semiconductor substrate materials, especially in indium phosphide, will directly benefit from the expansion of data centers and 5G/6G, but geopolitical export risks pose major uncertainties. Investment Insights: Mid-term outlook is positive for AI materials themes; it is recommended to focus on milestones in capacity implementation and geopolitical policy dynamics, controlling positions to cope with high volatility.
IV. Views & Dynamics
Brian Armstrong posted on the X platform that he remains optimistic about Bitcoin, still holding long positions. He stated that situations are never as good or as bad as they seem.
The "Oracle of Omaha" stated that technical analysis (TA) is more like traders' "astrology," essentially a combination of confirmation bias and market psychology used to gauge market sentiment rather than a core factor determining prices. The significant rise in several individual stocks is not driven by chart patterns but by fundamentals and expectations. For example, $SIVE's rise of about 1900% is linked to the market repricing future revenue expectations related to $JBL and $GFS; $AXTI's rise of about 800% is related to industry logic concerning indium phosphide substrates, photonics demand, and export controls.
The "Oracle of Omaha" further pointed out that technical analysis can only reflect market participants' psychological expectations; for instance, chart predictions around $IREN cannot offset the structural supply pressure brought by large-scale financing (ATM). The factors that truly determine stock price trends should include industry theme linkages, changes in earnings expectations, macro environment, earnings performance, and circulating structure.
Technical analysis (TA) may be useful for finding entry points, but the factors determining a stock's long-term potential should return to fundamentals and capital structure, rather than "chart faith."
The trading volume of tokenized Pokémon cards on crypto platforms has rapidly increased, forming a trading experience similar to "box opening/drawing cards" by mapping physical cards to NFTs or digital certificates through the "gacha" mechanism. According to data disclosed by Messari, approximately $230 million in transaction volume has been achieved across seven blockchains, including Solana, Polygon, Base, and BNB, in May, growing about tenfold compared to a year ago.
Pakistani Prime Minister Shehbaz announced on Sunday that the U.S. and Iran have declared an end to hostilities. The two sides are expected to hold a formal signing ceremony in Switzerland on Friday (June 19), followed by more detailed negotiations on nuclear issues. Shehbaz posted on the X platform: "A peace agreement has been reached between the United States and the Islamic Republic of Iran. Both sides have announced an immediate and permanent cessation of military actions on all fronts (including within Lebanon)." He added that the agreement "is now in effect." Trump confirmed this news and stated that he is currently lifting the U.S. blockade, expecting Iran to open the Strait of Hormuz. The Iranian side also responded.
According to Xinhua News Agency, the UK, France, Germany, and Italy issued a joint statement saying that after the U.S. and Iran reached an agreement to end the war, all parties are prepared to lift sanctions related to Iran in exchange for Iran taking measures regarding its nuclear program.
Analyst Darkfost posted on the X platform that, based on the on-chain behavior of long-term Bitcoin holders (those holding for more than six months), their activity of transferring BTC to exchanges still shows characteristics of "periodic high-intensity selling," typically manifested as daily inflows significantly exceeding annual averages (up to more than five times the average level).
In the short term, long-term Bitcoin holders are still transferring BTC to exchanges, indicating that periodic selling pressure still exists, and in most cases corresponds to actual selling behavior. However, from a long-term trend perspective, the annual average inflow of LTH to exchanges is continuously declining, showing that this group is generally more inclined to hold long-term, and the market's selling pressure structure is gradually smoothing out.
Data shows that this indicator has slightly rebounded recently, rising from about 630 BTC/day in early May to over 800 BTC/day, but it remains within the historically lowest level range since 2015. Analysts believe this change may be related to the increase in ETF funds and the proportion of institutional investors, leading to changes in the structure of long-term holders, but overall, the systematic selling pressure impact of LTH on the mid-to-long-term market is weakening.
V. Today's Market Calendar
Data Release Schedule
|-------|----|------------|-----| | 20:30 | U.S. | New York Fed Manufacturing Index | ⭐⭐⭐ | | 21:15 | U.S. | Industrial Production MoM | ⭐⭐⭐ | | 22:00 | U.S. | NAHB Housing Market Index | ⭐⭐⭐ |
Important Event Forecast
- G7 Summit: June 15-17 - Global economic policy coordination.
Institutional Views:
Well-known investment bank analysts generally believe that the U.S.-Iran agreement significantly improves risk sentiment, driving rebounds in stocks and cryptocurrencies, but the drop in oil prices highlights supply-demand rebalancing. The successful listing of SpaceX boosts confidence in technology, while Goldman warns that U.S. Treasury yields nearing 5% may pose pressure. In the crypto space, slight inflows into ETFs and leveraged liquidations support short-term rebounds, with institutions optimistic about BTC building a base in the current range, but emphasizing that Federal Reserve policies and macro data will determine trends in the second half of the year. Overall, the market has entered an observation period, focusing on the guidance of the G7 and economic data on liquidity, and suggesting attention to inter-asset linkages and valuation differentiation.
Disclaimer: The above content is compiled by AI search, with human verification for publication, and does not constitute any investment advice. The data in the text may inevitably contain deviations; please refer to real-time market data.
 Risk warning

Popular articles