Interest rate hikes are not a bearish signal, and hitting new highs is not a sell signal
 Core Viewpoint

 The Federal Reserve raised interest rates by 25 basis points to 3.75%-4.00%, yet the Nasdaq reached a new historical high a week later.
Original Title: History Says Investors Should Not Fear Fed Rate Hikes or Record Highs
Original Author: Phil Rosen, Opening Bell Daily
Editor’s Note: On September 16, the Federal Reserve raised the target range for the federal funds rate by 25 basis points to 3.75%-4.00%, marking an important step in the current policy cycle's shift back to rate hikes. A few days later, U.S. tech stocks quickly regained lost ground, and the Nasdaq Composite Index set a new historical high on September 22. This created a seemingly contradictory combination: monetary policy is tightening, yet the stock market simultaneously reaches record highs.
The most intuitive conclusion the market can draw is that rate hikes imply pressure on valuations, while record highs suggest limited room for further increases. However, Phil Rosen in Opening Bell Daily offers another perspective: both rate hikes and new highs cannot be interpreted in isolation from the economic environment at the time.
He cites historical data indicating that since 1982, the average return of the S&P 500 in the 12 months following a Fed rate hike has actually been higher than after a rate cut; and from a longer-term perspective, the subsequent performance of stocks bought near historical highs has not been significantly weaker than on other trading days.
This set of data does not mean "rate hikes are good for U.S. stocks," nor does it prove that the current market will necessarily continue to rise. What it truly challenges is a simpler trading logic: merely relying on "Fed rate hikes" or "indices reaching new highs" is not sufficient to justify a bearish outlook on the market. What needs to be assessed is why the Fed is raising rates at this time and whether the earnings and economic conditions supporting the stock market's rise still exist.
The following is the original text compiled:
The Federal Reserve has just raised rates, yet the U.S. stock market has once again reached historical highs.
On September 16, the Federal Reserve raised the target range for the federal funds rate by 25 basis points to 3.75%-4.00%. The FOMC stated that U.S. economic activity continues to expand at a "robust pace," domestic spending remains resilient, capital investment is strong, and inflation remains elevated.
Less than a week later, the U.S. tech sector regained strength. On September 22, the Nasdaq Composite Index set a new historical record. Reuters linked the rebound to multiple factors, including the strength of tech stocks, renewed interest in AI trading, and a decline in oil prices.
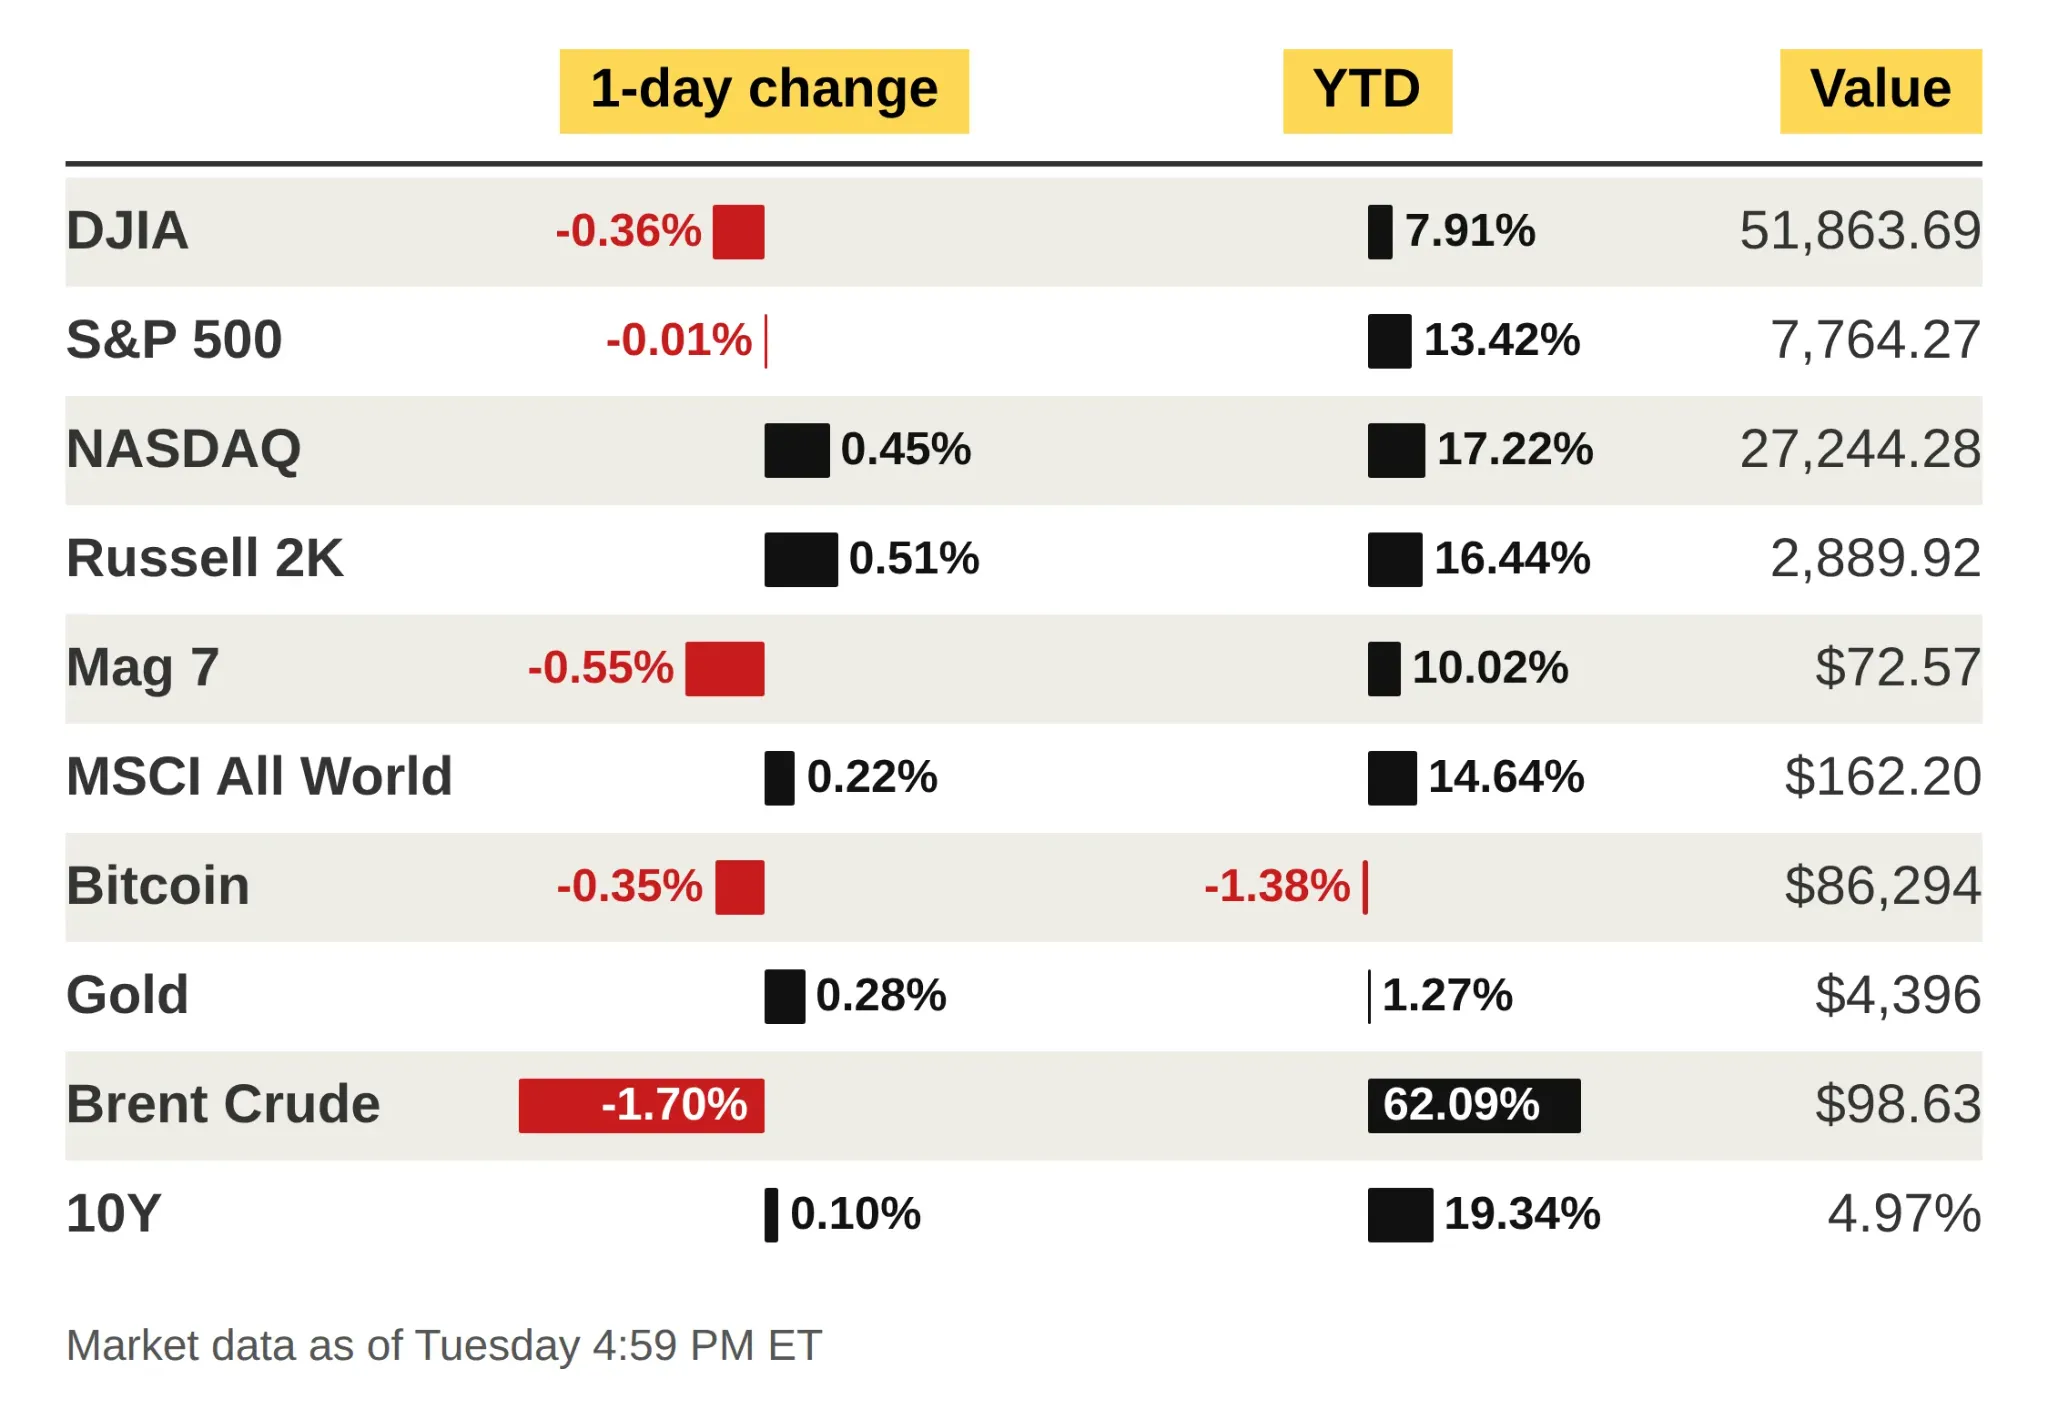
Performance of major asset markets on September 22, with the Nasdaq rising 0.45% that day and a year-to-date increase of 17.22%. Source: Opening Bell Daily
On the surface, "rate hikes + historical highs" seem to be two signals that warrant caution: higher rates may compress stock valuations, while indices at record levels may lead investors to worry that prices have risen too much.
However, historical data does not support such a simplistic conclusion.
Rate Hikes Are Not a "Bearish Button": Average Returns After Rate Hikes Are Higher
Opening Bell cites data compiled by Charlie Bilello, Chief Market Strategist at Creative Planning, stating that since 1982, the average increase of the S&P 500 in the 12 months following a Fed rate hike has been 14.9%; while the average increase in the 12 months following a rate cut has been 11.2%.
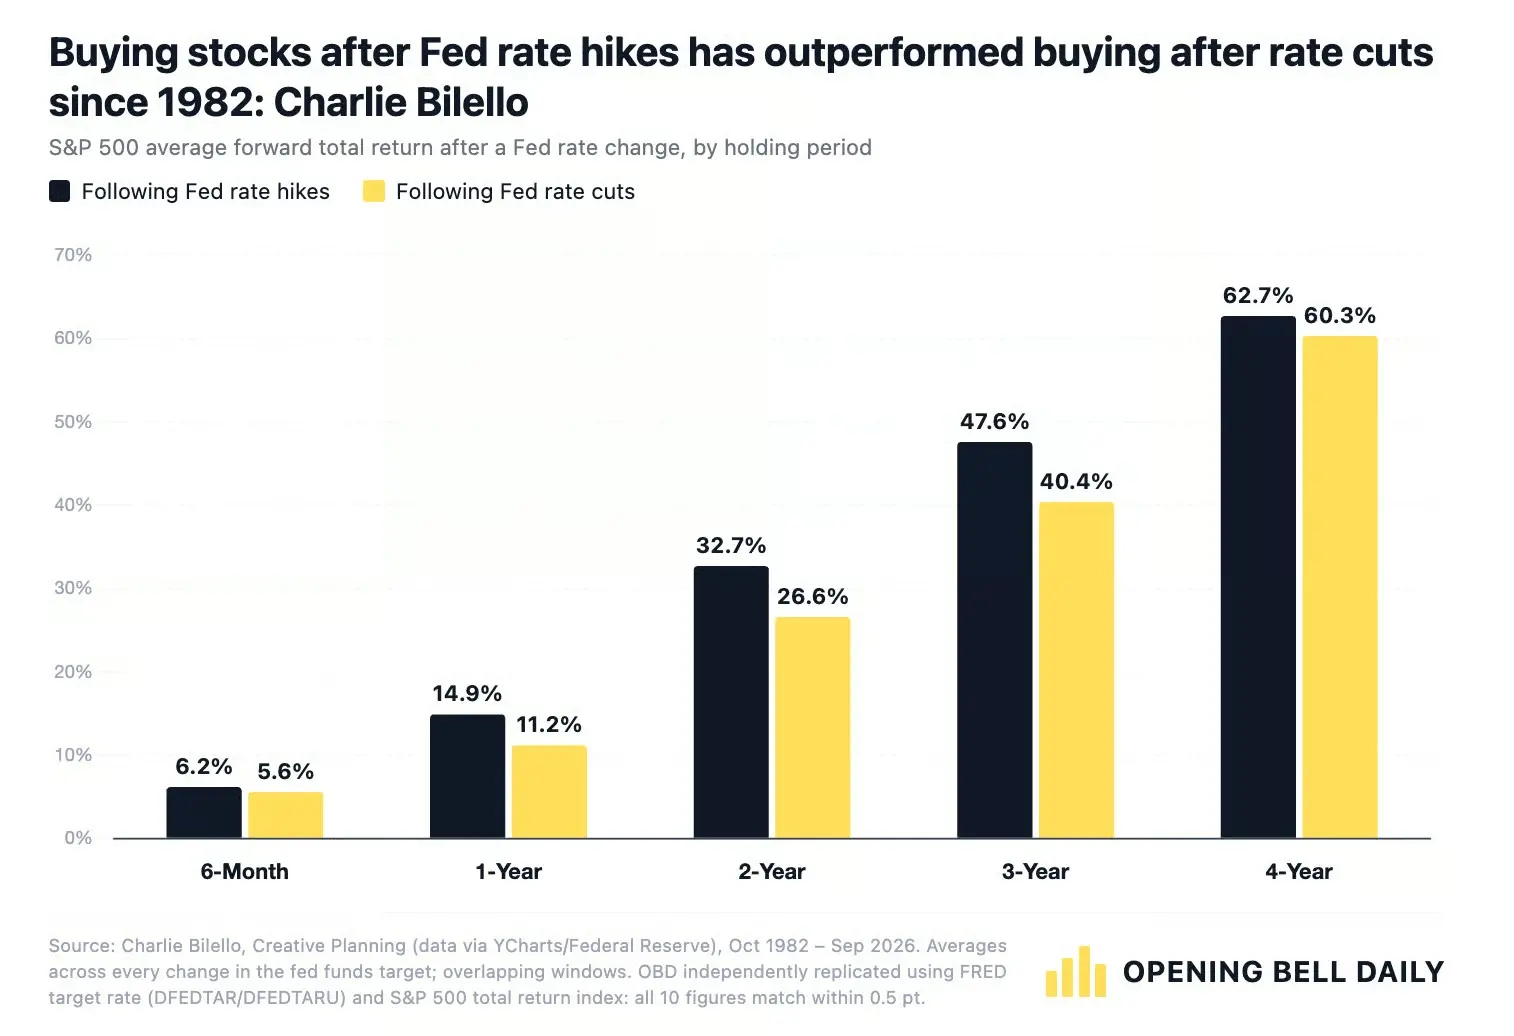
Since 1982, the average forward return of the S&P 500 after Fed rate hikes has been higher than after rate cuts, with one-year average returns of 14.9% and 11.2% respectively.
This result contradicts the most common market intuition.
According to simple asset pricing logic, a decrease in interest rates means lower financing costs and a lower discount rate for future cash flows, which should theoretically be more favorable for stocks; rate hikes have the opposite effect. But Rosen argues that merely observing the policy actions themselves overlooks a more important question: Why is the Fed raising or lowering rates at this point in time?
Generally speaking, the ability of the Federal Reserve to raise rates often indicates that the economy still possesses a certain degree of resilience. Corporate earnings, employment, and consumption may still remain robust, allowing the Fed to have the space to suppress inflation through higher rates.
Conversely, rate cuts often occur in a different macroeconomic environment: slowing economic growth, deteriorating labor markets, financial system pressures, or rising recession risks.
Therefore, Rosen's core judgment is not that "rate hikes drive the stock market up," but rather that: monetary policy itself has endogeneity. Rate decisions not only affect future economic conditions but also reflect the current state of the economy.
In other words, if one ignores the economic cycle and equates "rate hikes" with "bearish for stocks," it is easy to misunderstand the causal relationship.
What Matters Is Not the Direction of Rates, but the Economic State Behind Rate Hikes
This logic is especially important in the current environment.
The economic description provided by the Fed during this rate hike is not weak. The official statement indicates that the U.S. economy is still expanding steadily, domestic spending remains resilient, productivity growth is strong, capital investment is solid, and employment growth is generally in line with labor supply; meanwhile, inflation remains above policy targets.
This suggests that, at least from the Fed's current policy judgment, this rate hike is not tightening further in the context of a clearly declining economy, but rather continuing to address inflation against a backdrop of resilient growth.
This is also why simply seeing the words "Fed rate hike" is not sufficient to directly infer the direction of the stock market in the next phase.
The truly important question is: As rates remain high, can corporate earnings, consumer spending, and employment continue to absorb tighter financial conditions?
If they can, then the rate hike itself may not be enough to end the upward trend; if high rates ultimately significantly dampen demand and earnings, then the historical average returns will also lose their explanatory power for the current market.
New Highs Are Not a Sell Signal Either; Historical Data Even Slightly Favors Buying
A similar logic applies to another common concern: "Is it still worth buying now that we are at historical highs?"
Opening Bell cites data from FactSet stating that since 1950, buying the S&P 500 when it reaches a historical high has yielded an average return of about 9.5% in the subsequent 12 months; in contrast, the average one-year return from buying on other trading days is about 9.3%.
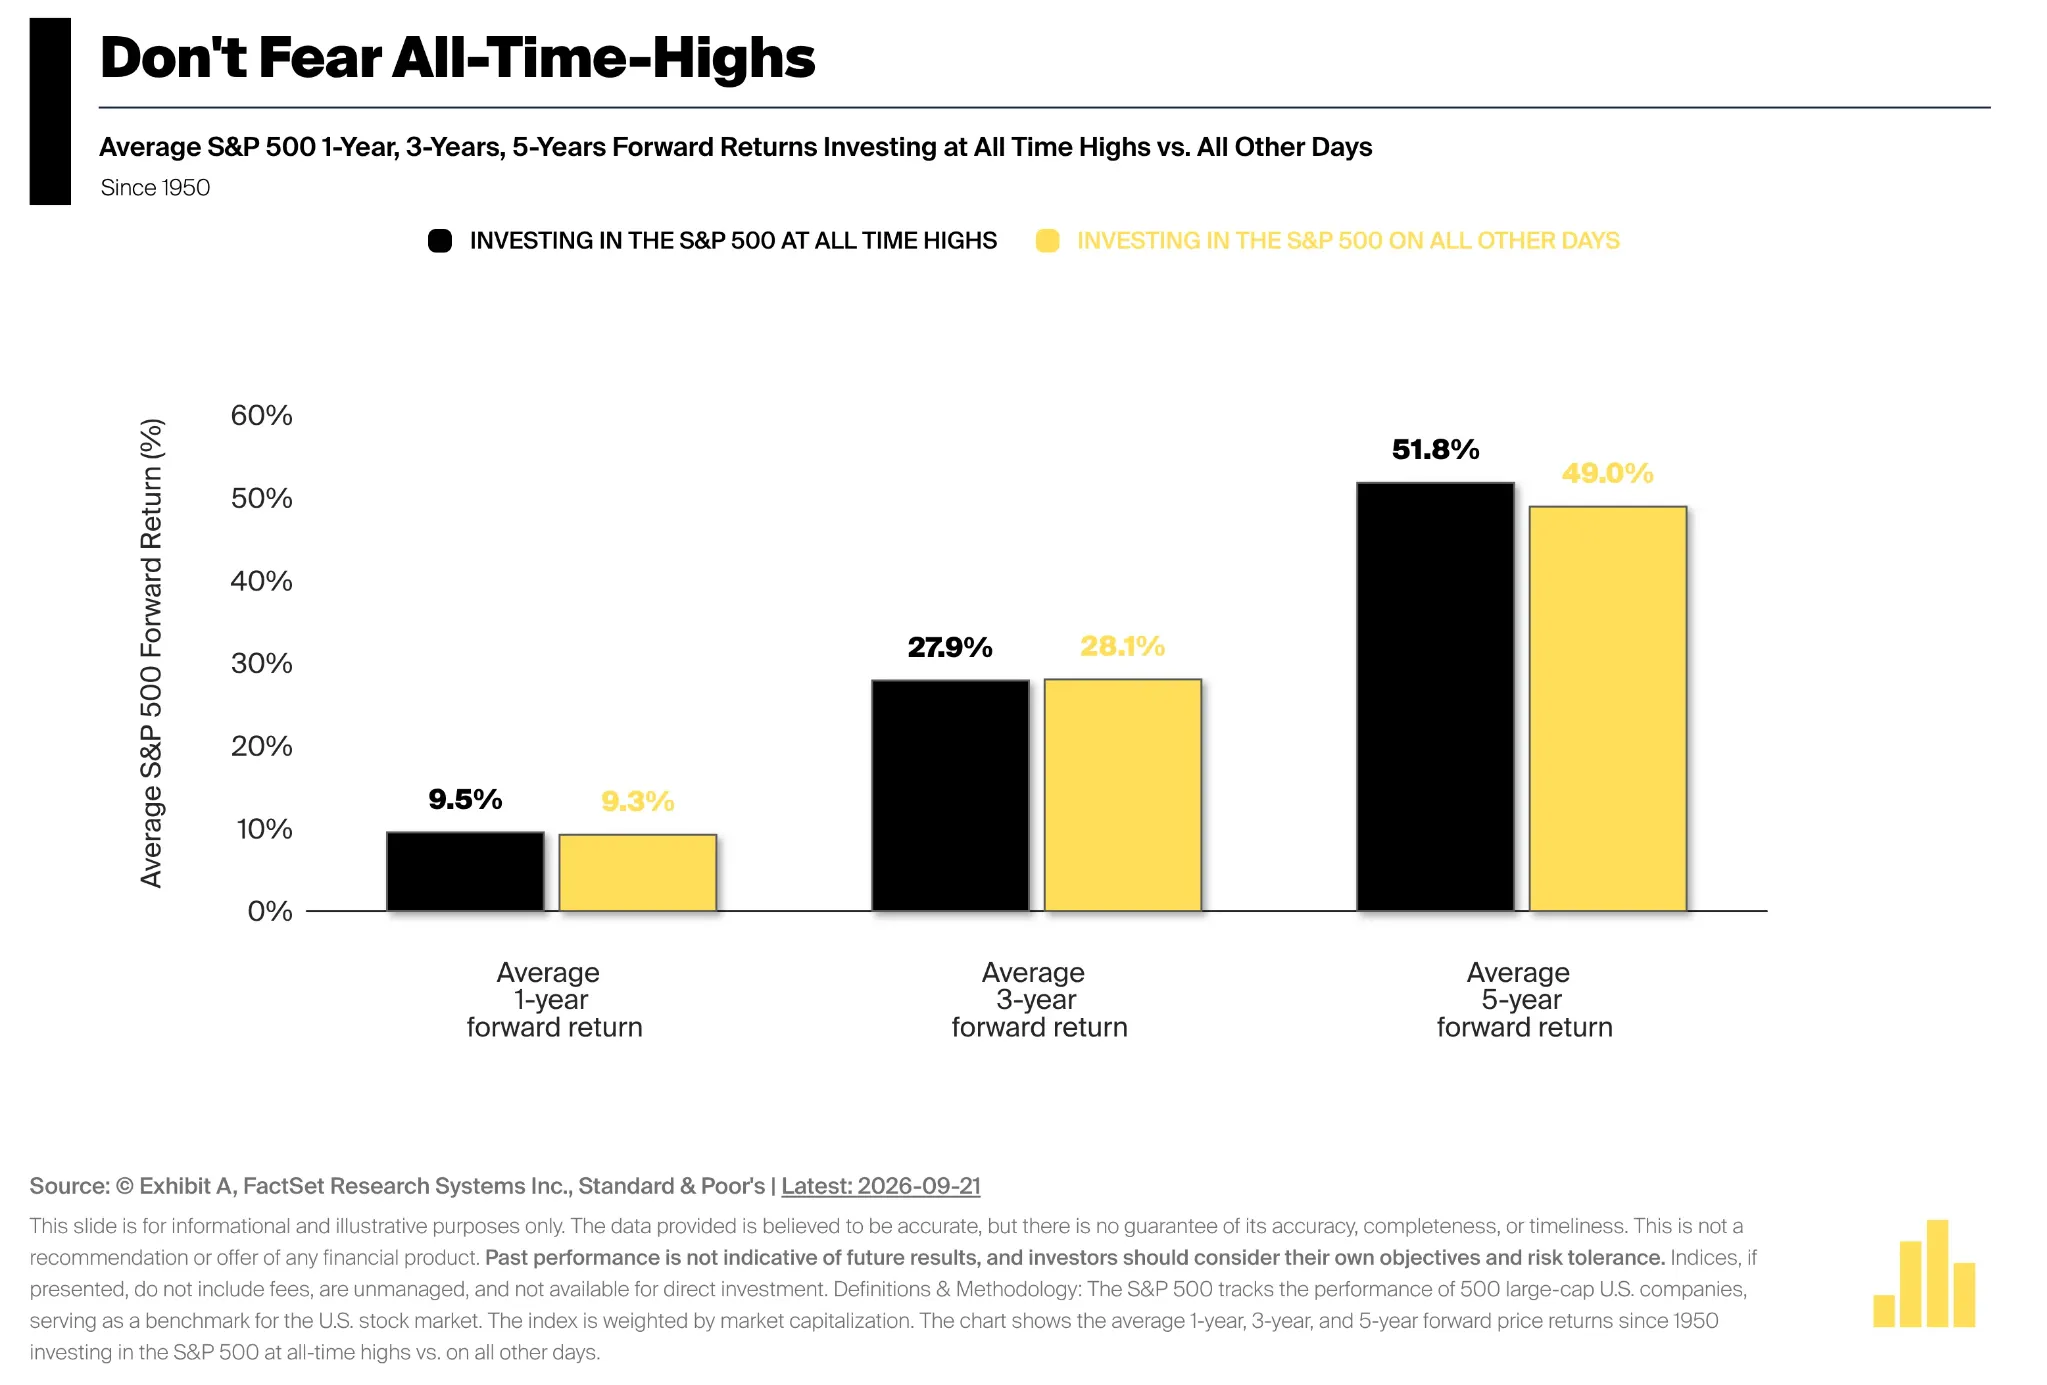
Average subsequent returns from buying at historical highs versus other trading days since 1950. One-year returns are 9.5% and 9.3%, and five-year returns are 51.8% and 49.0%, respectively.
Independent data also shows similar conclusions. Statistics from Vanguard based on FactSet and Morningstar Direct data indicate that as of September 2025, the average return one year after buying the S&P index at historical highs is also 9.5%, while on other trading days it is about 9.2%; over three and five years, the average cumulative returns after buying at historical highs are not significantly lagging. The specific numerical difference of 0.1 percentage points in the "other trading days" data may relate to sample cutoff dates and data processing methods, but the overall direction is consistent.
What is truly noteworthy here is not that buying at historical highs yields slightly higher returns than ordinary trading days, but rather that historical highs themselves do not demonstrate a stable negative predictive ability.
Rosen explains that market records often occur in succession. A continuously rising market may keep setting new highs, and whether it is the first, fifth, or even tenth time reaching a new high does not alone inform investors when a bull market will end.
Thus, "prices are already high" and "prices will soon fall" are not the same judgment. More accurately, historical data can only indicate that being at historical highs does not alone constitute evidence of future returns deteriorating.
With Rate Hikes and New Highs, What Should We Really Watch Next?
From this framework, what is most worth observing in the current U.S. stock market is not the static facts of "the Fed has already raised rates" or "the Nasdaq has reached new highs," but whether the macro conditions supporting them will change.
On one hand, we need to continue observing whether U.S. corporate earnings, consumption, and employment can maintain resilience. If the real economy can still withstand higher rates, then the historical explanation of "rate hikes occurring during a strong economy" remains valid.
On the other hand, we need to watch whether tightening policies begin to produce more pronounced lagging effects. If interest-sensitive sectors such as housing and automobiles weaken further and gradually transmit to consumption, employment, and corporate profits, then the implications of this rate hike will change.
Historical average data also needs to be used cautiously. Different rate hike cycles since 1982 have varying levels of inflation, valuations, earnings environments, and financial conditions; past average returns after buying at historical highs cannot directly infer that similar returns will be achieved in the next 12 months.
Therefore, this set of data is better suited to eliminate an overly simplistic judgment rather than provide new certainty trading signals: rate hikes do not inherently mean U.S. stocks should fall, and historical highs do not inherently mean the market has ended.
The fundamental question that will determine the next phase of market direction remains whether the economy and earnings can continue to support current prices.
 Risk warning