The Nasdaq reached a new closing high, Nvidia approached 6 trillion USD, but the most extreme market movements last night were in biomedicine

 The S&P 500's eleven major sectors saw ten rise and one fall, with Materials (+1.22%) and Communication Services (+1.14%) leading the gains. However, the truly extreme market conditions appeared in Biopharmaceuticals.
Introduction: On October 5th, the U.S. stock market presented an intriguing combination: the 10-year Treasury yield closed above 5.30%, while the Nasdaq reached a historic closing high; on the same day, a biotech stock briefly doubled in pre-market trading. The index hit a new high, but the market internally showed signs of divergence—this combination is worth dissecting.
1. The most extreme gains last night were not in the index
The market appeared lively that day: ten of the eleven sectors in the S&P 500 rose, with Materials (+1.22%) and Communication Services (+1.14%) leading the gains. However, the truly extreme action occurred in biotech.
Vaxcyte (PCVX) briefly surged over 85% in pre-market trading, triggered by its 31-valent pneumococcal conjugate vaccine VAX-31 achieving all predefined primary endpoints in a pivotal Phase 3 trial (OPUS-1). According to company disclosures and public reports: in a head-to-head design across approximately 30 research centers with over 4,000 subjects, VAX-31 met non-inferiority standards for all 20 serotypes shared with Pfizer's Prevnar 20, and achieved standards for 17 of the 19 serotypes shared with Merck's Capvaxive, showing superiority on its unique serotypes; tolerance was similar to the control vaccine. The closing gain fell back to 30.7%, closing at $73.82. The same sector also saw Novavax (NVAX) rise about 20%, and Moderna increase nearly 7%.
It is important to objectively recognize that meeting non-inferiority standards is a high standard result under this trial design, but "meeting standards" does not equate to "superior," and according to public reports, the company still needs results from two additional trials before submitting its listing application. There remains uncertainty regarding the subsequent validation of clinical trial data.
This is a day worth delving into. With the 10-year Treasury yield still above 5.3%, reportedly near its highest level since 2002, the Nasdaq is reaching historic highs, and a biotech stock nearly doubled in pre-market trading. What exactly is the market paying for? Let's break it down.
2. Nvidia: One step away from $6 trillion
Nvidia rose 2.12% that day, closing at $238.9, hitting a historic high of $240.1 during the day, with a market cap of approximately $5.79 trillion—about 3.7% away from $6 trillion. On October 2nd and 5th, its intraday highs set new historical records; it took just about a year to cross from a market cap of around $5 trillion (by the end of October 2025) to now approaching $6 trillion.
According to implied pricing in the options market (as reported), the probability of Nvidia's market cap surpassing $6 trillion this month is about 50%, about 13% this week, and about 67% before December 18.
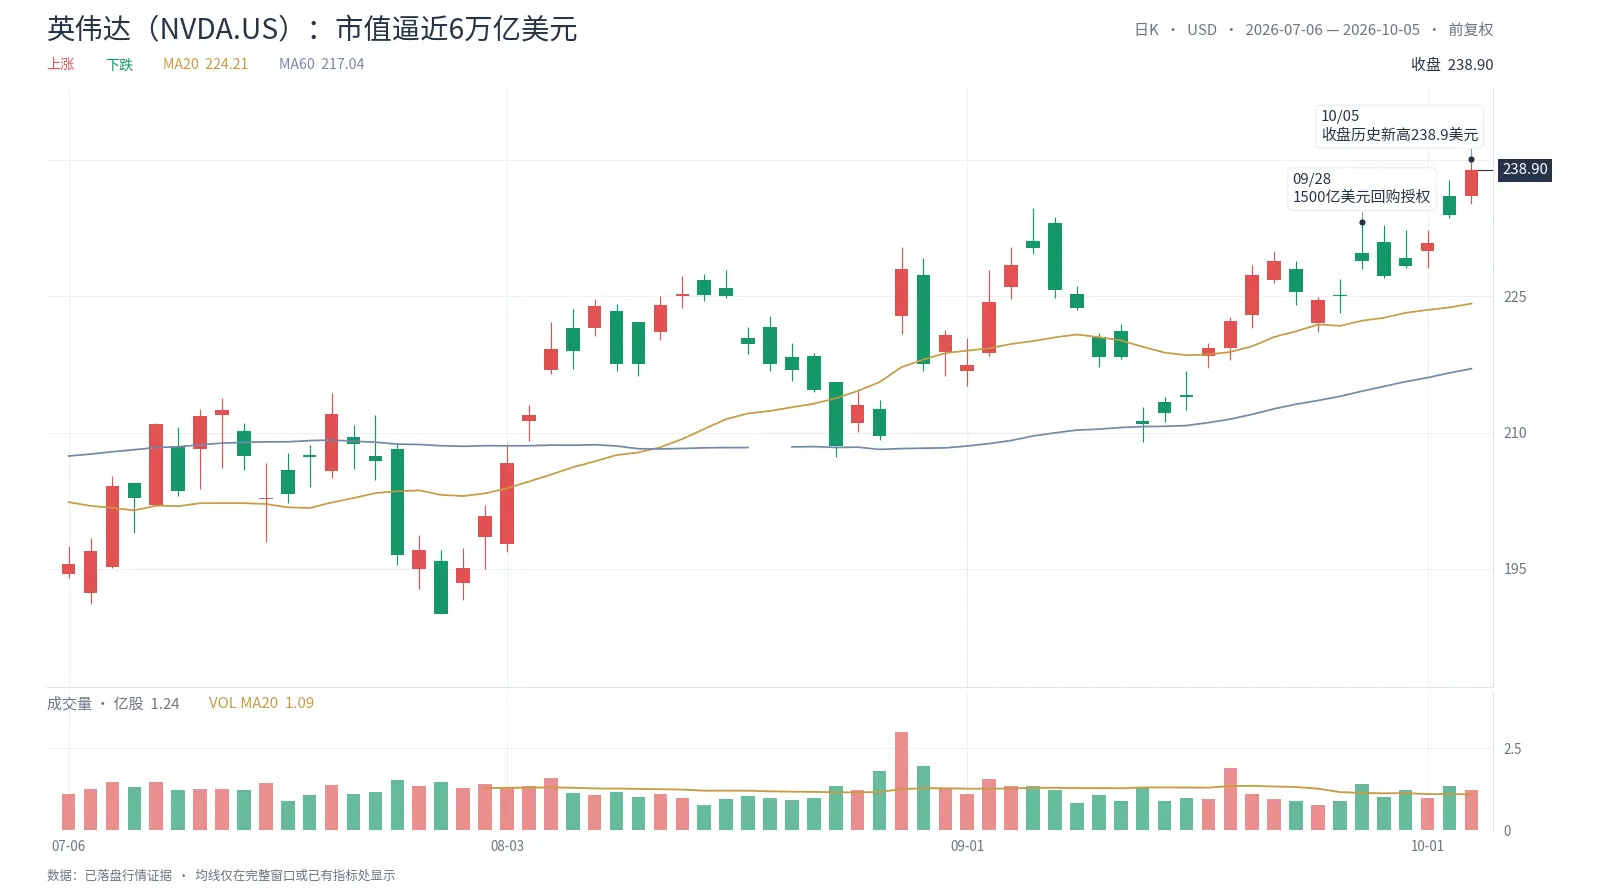 What drove Nvidia's strength was less about new news that day and more about the $150 billion stock buyback authorization announced on September 28—reported as the largest in history. A rate strategy head at an asset management firm commented on this: "Stock buybacks are not just about shareholder returns; they are a capital allocation event reflecting confidence in long-term AI demand."
However, there was a clear divergence within the semiconductor sector. The Philadelphia Semiconductor Index briefly turned negative during the day (reportedly about -1%), closing up only 0.27%; AMD, Intel, Micron Technology, and ASML weakened, while TSMC and Broadcom rose over 2%. Funds have been making more refined selections within the AI chain—core computing power targets continued to be bought, while traditional semiconductors and memory stocks faced pressure.
3. SpaceX: Musk returns to trillionaire status
SpaceX (SPCX) closed up 7.63% at $171.09, reaching a new high since mid-June. A major U.S. bank reportedly maintained an 'overweight' rating and a $300 target price in a weekend report, with core logic pointing to the growth potential of Starship test flights and AI business; the bank noted that the quarterly earnings report in late October and the next Starship test flight are two time windows worth watching, and believes that if SpaceX attempts to recover the upper stage of the Starship in the next test flight, it could become one of the most important catalysts since the company's IPO.
Musk's net worth has once again surpassed $1 trillion: according to Forbes' real-time billionaire list, including his holdings in Tesla and SpaceX, it is approximately $1.03 trillion. He first became a trillionaire after SpaceX's IPO on June 12, but the stock price subsequently fell, and he briefly lost that title within just over ten days, during which he referred to himself on social media as a "former trillionaire."
More noteworthy is the change in SpaceX's valuation anchor: shifting from "launch count" and "Starlink user count" to "computing power connectivity capability." The company acquired Musk's xAI in February this year and recently acquired Cursor, while also generating substantial income by leasing computing power resources to companies like Google and Anthropic; defense contracts have exceeded $12.7 billion, and the Pentagon announced last week that Musk and others will jointly lead Project Meridian, researching weapons and technologies that may be needed for future U.S. warfare.
4. Chinese concept stocks: Behind the independent market
The Nasdaq Golden Dragon China Index rose 1.71%. GDS Holdings and Century Internet rose over 6%, Alibaba rose over 4%, Baidu, Hesai Technology, and Vipshop rose over 3%, while JD.com and Bilibili rose over 2%.
The recent rebound of Chinese concept stocks is relatively weakly correlated with U.S. Treasury rates. A widely discussed explanation in the market is that Chinese concept stocks are overall less sensitive to U.S. Treasury yields compared to high-valued growth stocks in the U.S.—when the 10-year Treasury yield stands above 5.3%, the valuation anchor of U.S. growth stocks is suppressed, while Chinese concept stocks have seen significant adjustments and are at relatively low valuations, motivating funds to make phase-based valuation repairs. In addition, multiple factors such as company performance, liquidity, and policy expectations are also at play.
5. But the market is splitting internally
While the Nasdaq reached a historic high, the market's "breadth" continues to deteriorate.
The chief equity strategist at a major U.S. bank pointed out in a recent report that among the constituents of the Russell 3000 index, 51% have fallen over 20% from their June highs, entering what is typically defined as a bear market; the median stock in the S&P 500 is down 16% from its 52-week high, with market breadth at its lowest level since the dot-com bubble burst. The strategist estimated that there is about a 12% divergence gap between the current breadth of the U.S. stock market and index prices—this divergence typically needs to converge in some way: either the index corrects downward to "meet" market breadth, or bond volatility cools, and individual stocks rally to widen the market again.
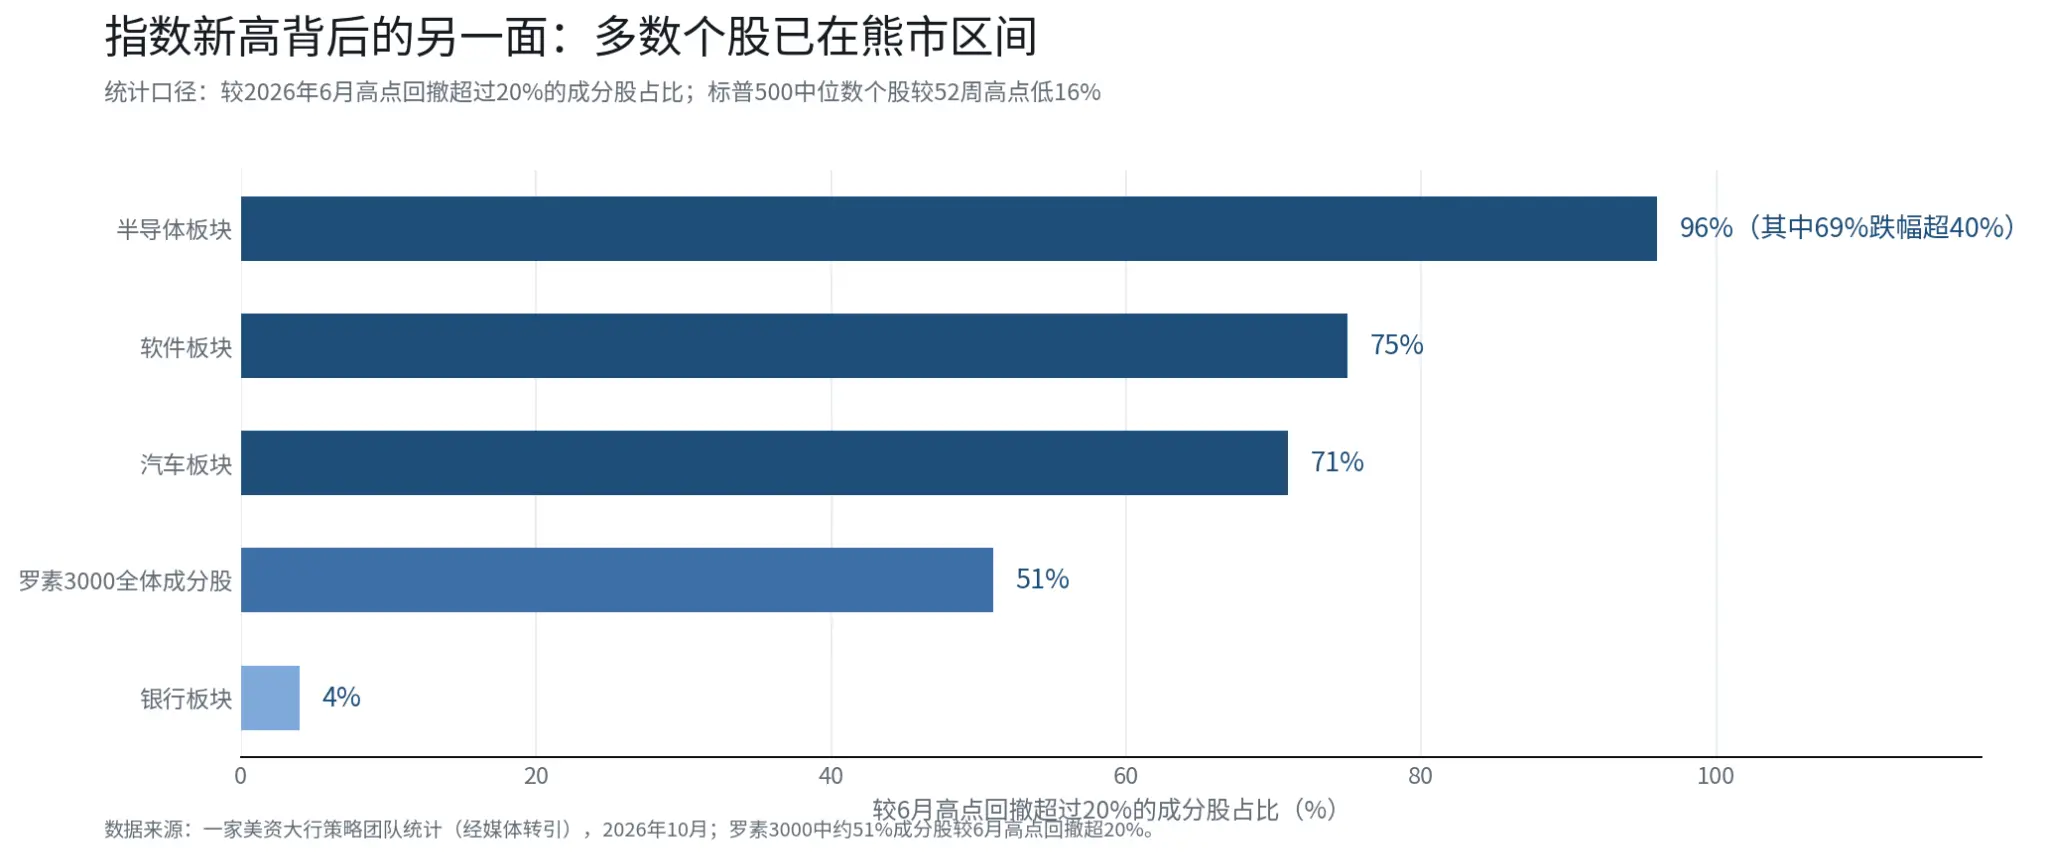 By sector, the damage distribution is extremely uneven. In the semiconductor sector, 96% of stocks have retreated over 20% from their June highs (with 69% declining over 40%); the software sector has a ratio of 75%, and the automotive sector is at 71%; the banking sector is the only exception, with only 4% experiencing similar declines.
The timing of the analysis is also worth noting. Throughout the summer, the proportion of S&P 500 constituents above the 200-day moving average rose from 59% at the end of May to about 75%—even as oil and Treasury yields rose simultaneously, breadth continued to improve; however, this trend sharply reversed after the Jackson Hole global central bank meeting in late August, currently falling to 49%. The strategist believes that the sudden narrowing of breadth is not caused by rising oil prices but rather by the market beginning to digest a more hawkish Federal Reserve path after Jackson Hole.
Another divergence worth being cautious about is that the MOVE index, which measures Treasury volatility, has surpassed 100, while the VIX fear index remains below 15. The strategist warned that if bond volatility cannot calm down, there is a possibility that the S&P 500 could dip to around 6800 to 7300 points in the next month (this scenario is a simulation by the institution, not a certainty).
6. Earnings remain one of the main supports currently
Investors are willing to hold tech stocks in a 5.3% interest rate environment, with one core reason being earnings growth. According to FactSet data, analysts predict that S&P 500 constituents' earnings will grow nearly 30% year-over-year in the third quarter; if realized, it would mark the third consecutive quarter of growth exceeding 25%.
However, this growth increasingly relies on a few AI-weighted stocks. Nvidia's market cap has risen from about $5 trillion to $5.79 trillion in just about a year, while about half of the stocks in the Russell 3000 are actually experiencing their own bear markets—new highs in the index and declines in most individual stocks are occurring simultaneously.
An Asian bank research institution believes that Nvidia's current price-to-earnings ratio, combined with an expected earnings growth rate of about 70% next year, indicates that AI-driven tech stocks are still far from a typical bubble; another major U.S. bank reportedly maintains its 'overweight' view on U.S. stocks and gives a 12-month target level of 8600 points for the S&P 500. This view only represents the judgment of the relevant institution. However, the aforementioned strategist's reminder is also worth noting: when half of the stocks have entered bear markets while the index is still hitting new highs, this structural concentration may amplify the downside risk of the index when the interest rate environment changes.
Conclusion
Last night's combination was: new highs in the index, high interest rates, deteriorating breadth, and a surprising performance in biotech. It suggests not a simple "bullish" or "bearish" outlook, but rather structural divergence—earnings realization of a few weighted stocks running parallel to valuation declines of most individual stocks; rising interest rates have not yet overwhelmed earnings, but changes in bond volatility could be the next key variable. The fourth-quarter earnings season and the Federal Reserve's path are two verification points worth tracking in the future.
Engage with us: The Nasdaq hits a new high, but about half of the stocks in the Russell 3000 have entered bear market territory—where do you feel your holdings align more closely? Feel free to discuss in the comments.
We will continue to track changes in U.S. Treasury yields and market breadth.
Data Source
Market: Nasdaq 27,477.31 (+1.05%), S&P 500 7,773.95, Dow Jones 51,267.90; fluctuations of Nvidia, SpaceX, Vaxcyte, etc. Closing on October 5, public market data.
U.S. Treasury: 10-year yield closed above 5.30% (approximately 5.303%---5.307%). Closing on October 5, public market data.
Breadth and institutions: 51% of Russell 3000 down over 20% from June highs, median S&P 500 stock down 16% from 52-week highs, MOVE > 100, VIX < 15; institutional views as seen in major U.S. bank reports. October, media references, now desensitized.
Nvidia: Market cap approximately $5.79 trillion; $150 billion buyback authorization. October 5/September 28, public market data/company announcements.
Vaxcyte: VAX-31 Phase 3 achieved primary endpoints; pre-market up over 85%, closing up 30.7%. October 5, company announcements/public reports.
Earnings: S&P 500 third-quarter earnings growth forecast near 30%. October, FactSet.
Disclaimer: The content of this article is for general information and market commentary purposes only, compiled based on publicly available information as of the time mentioned in the text. Relevant market data, expectations, and probabilities may change with market conditions. The views and investment strategies cited from third-party institutions, analysts, or other individuals only represent the views of the relevant third parties at a specific time and do not represent the views or recommendations of BIT. This article does not constitute investment advice, investment research, an offer, solicitation, or recommendation of any securities, investment products, or trading strategies, nor should it be used as a basis for any investment decision. Financial markets carry risks, and securities prices and market performance may fluctuate; past performance and historical market trends do not represent or guarantee future results. Investors should independently assess the relevant risks based on their own circumstances and seek professional advice when necessary.
 Risk warning



Popular articles