Gold prices fell to $4,066: it's not that safe-haven assets have failed, but that the cost of holding U.S. Treasuries has won

On October 7, spot gold opened high at $4163.97. After reaching a peak of $4170 during the Asian session, it fell sharply, dipping to $4066 during the New York session, marking the lowest point since August 5, and closed at $4110.68, down 1.28%. On the same day, a $39 billion 10-year U.S. Treasury auction was awarded at 5.300%, with a bid-to-cover ratio of 2.77, significantly higher than the recent average of 2.54.
Many reports linked these two events: "Gold falls, U.S. Treasuries are in demand." However, when the timeline is laid out, there is a clear flaw in this statement: the sell-off in gold occurred before the auction results were announced. The sequence of events—first falling, then stabilizing—provides more information than the rise and fall itself.
I. Correcting the Causal Sequence
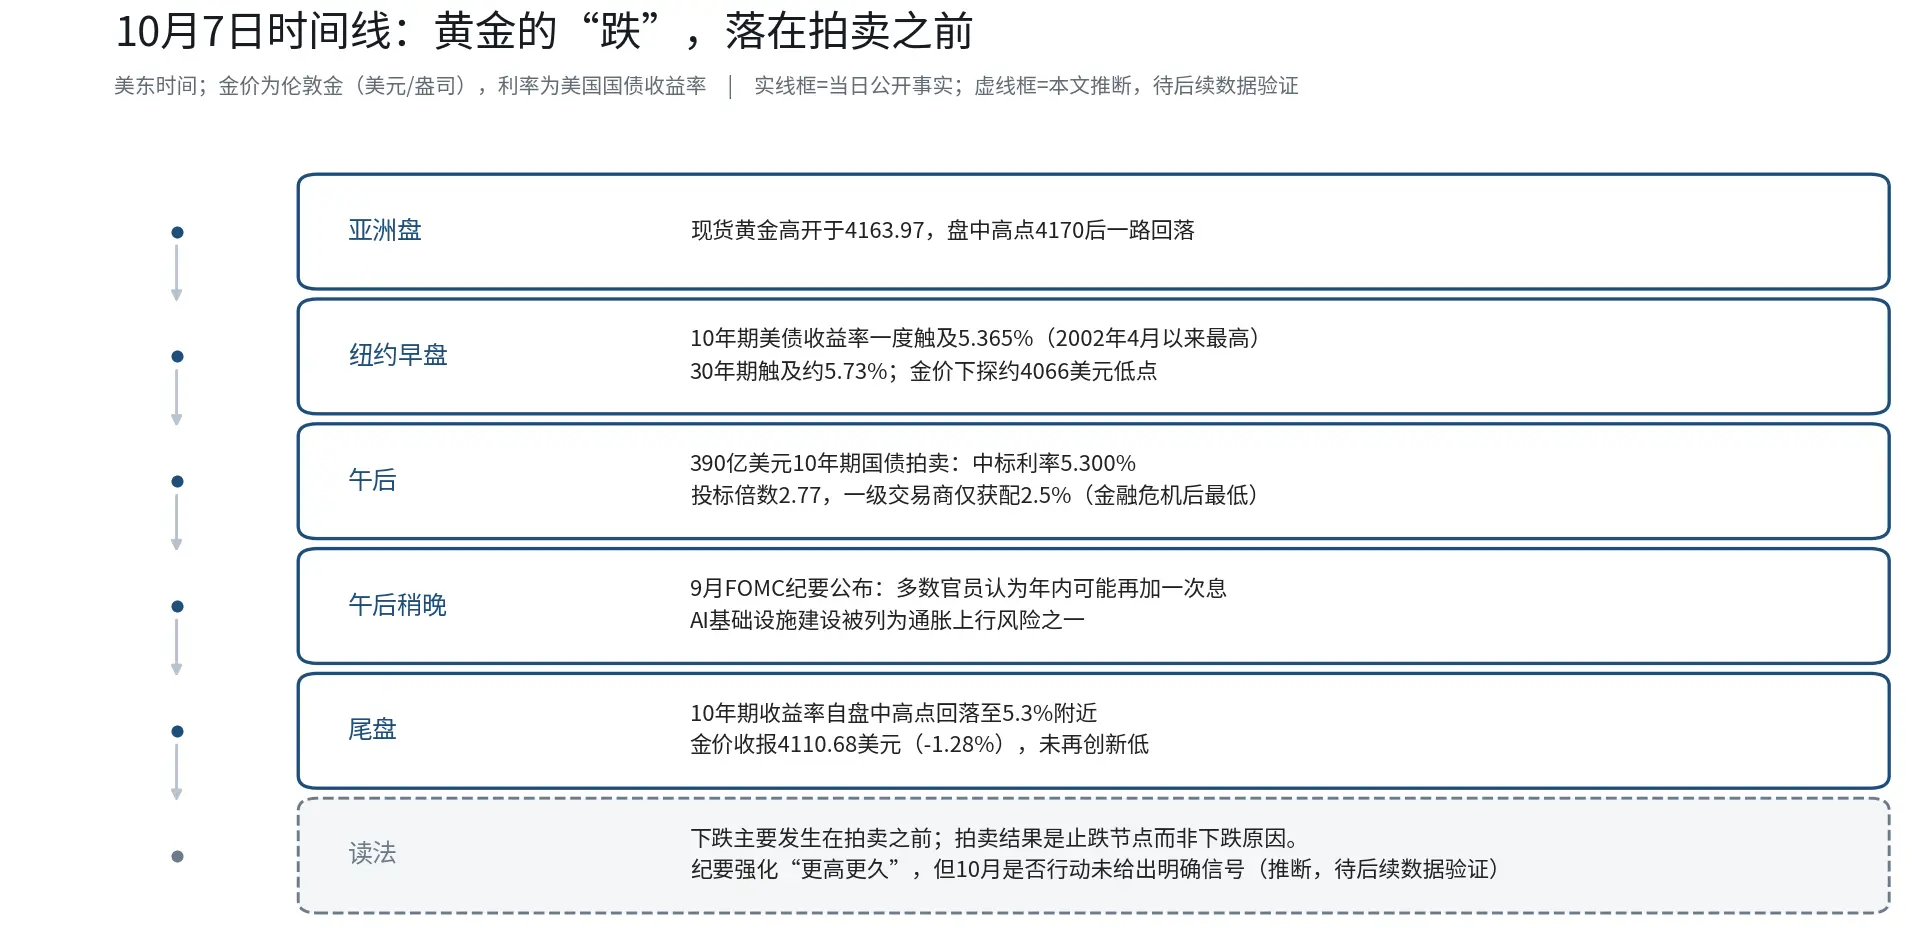
The market moved in this order that day: gold surged and then retreated during the Asian session; in the New York morning, the 10-year U.S. Treasury yield briefly surpassed 5.34%, reaching a new high since April 2002, while the 30-year yield touched 5.73%, causing gold prices to fall below $4100 and down to $4066; in the afternoon, the auction results were announced, with the awarded rate of 5.300% actually lower than the pre-auction market level (5.317%), leading to a decline in yields from their highs, and gold prices recovered to close at $4110; on October 8, during the Asian session, gold further rebounded to around $4130.
The conclusion is straightforward: the only event that clearly favored gold that day was the auction that was suspected of "crashing gold." Attributing the decline in gold to the auction is treating the turning point as the starting point.
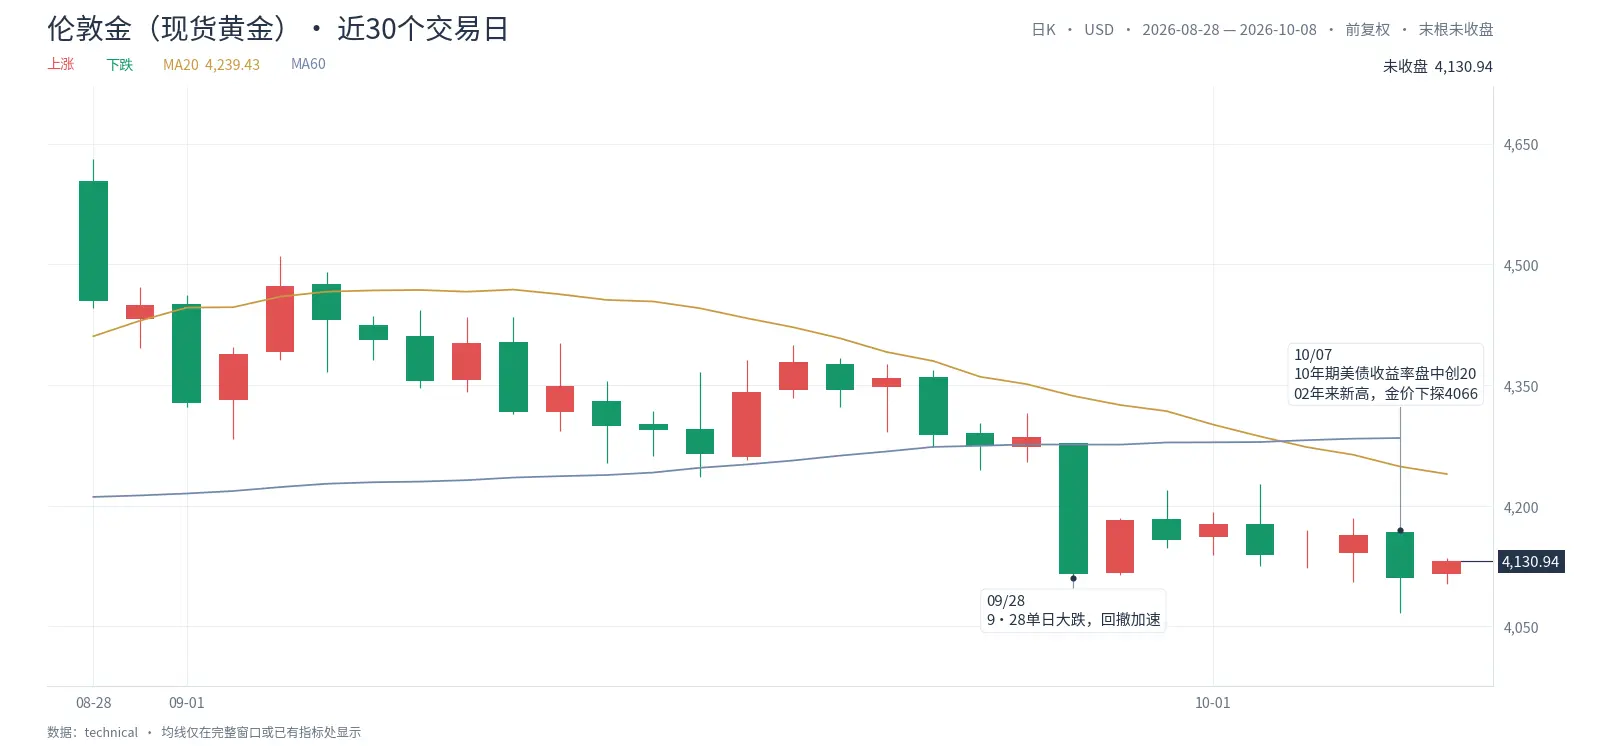
Another often overlooked background: this was not a one-day event. Gold was still between $4630 and $4700 at the end of August, and after a significant drop on September 28, it accelerated its retreat, closing on October 7 about 12% lower than the 60-day high. $4066 was merely a formal break below the low since August 5. The single-day crash is the result; the two weeks of gradual decline are the process.
II. The Minutes Confirm Old Expectations, Not New Bearish Signals
The FOMC meeting on September 15-16 was held three weeks ago, but the minutes were only released on the afternoon of October 7, Eastern Time, so they represent last night's information—just with very limited incremental value.
The minutes confirmed three things: a unanimous vote to raise rates by 25 basis points; most officials believe there may be one more rate hike this year; no signals were given regarding action in October. Before the minutes were released, the futures market had priced in only about 19% for October, while December's rate hike was fully priced in. The market had already incorporated the "one more hike this year" into the prices; the minutes merely documented the already priced expectations. Attributing last night's volatility to "hawkish minutes" is treating old expectations as new bearish signals.
What is truly new is another point: some participants listed AI infrastructure construction as one of the upside risks for mid-term inflation. The entry of AI capital expenditure into the central bank's inflation discussion is a change worth tracking separately—but it was not the starting point for the decline in gold prices that day. The new high in yields and the contributions from oil prices and inflation expectations likely took precedence over the minutes.
III. Gold Lost a Simple Arithmetic Problem
Rather than saying the safe-haven logic failed, it is more accurate to say that gold was defeated by its own holding costs.
The yield on the 10-year U.S. Treasury has exceeded 5.3%, while gold itself does not generate interest. The implicit cost of holding gold for a year is the portion of that 5.3% minus inflation. This is not an emotional issue; it is an arithmetic issue.
The second layer of pressure comes from the dollar: the dollar index rose to around 102.3, breaking through the year's high, making gold priced in dollars more expensive for non-U.S. buyers. As for the escalating situation in the Middle East and Brent crude prices surpassing $100—textbook theory suggests this should boost safe-haven buying, but this time it did not, because the direction of rising oil prices is inflation expectations and long-term rates, which is a net negative for gold. When textbooks fail, it is usually because the weight of interest rate variables has overshadowed everything else.
IV. The More Memorable Number Than Gold Prices is 2.5%
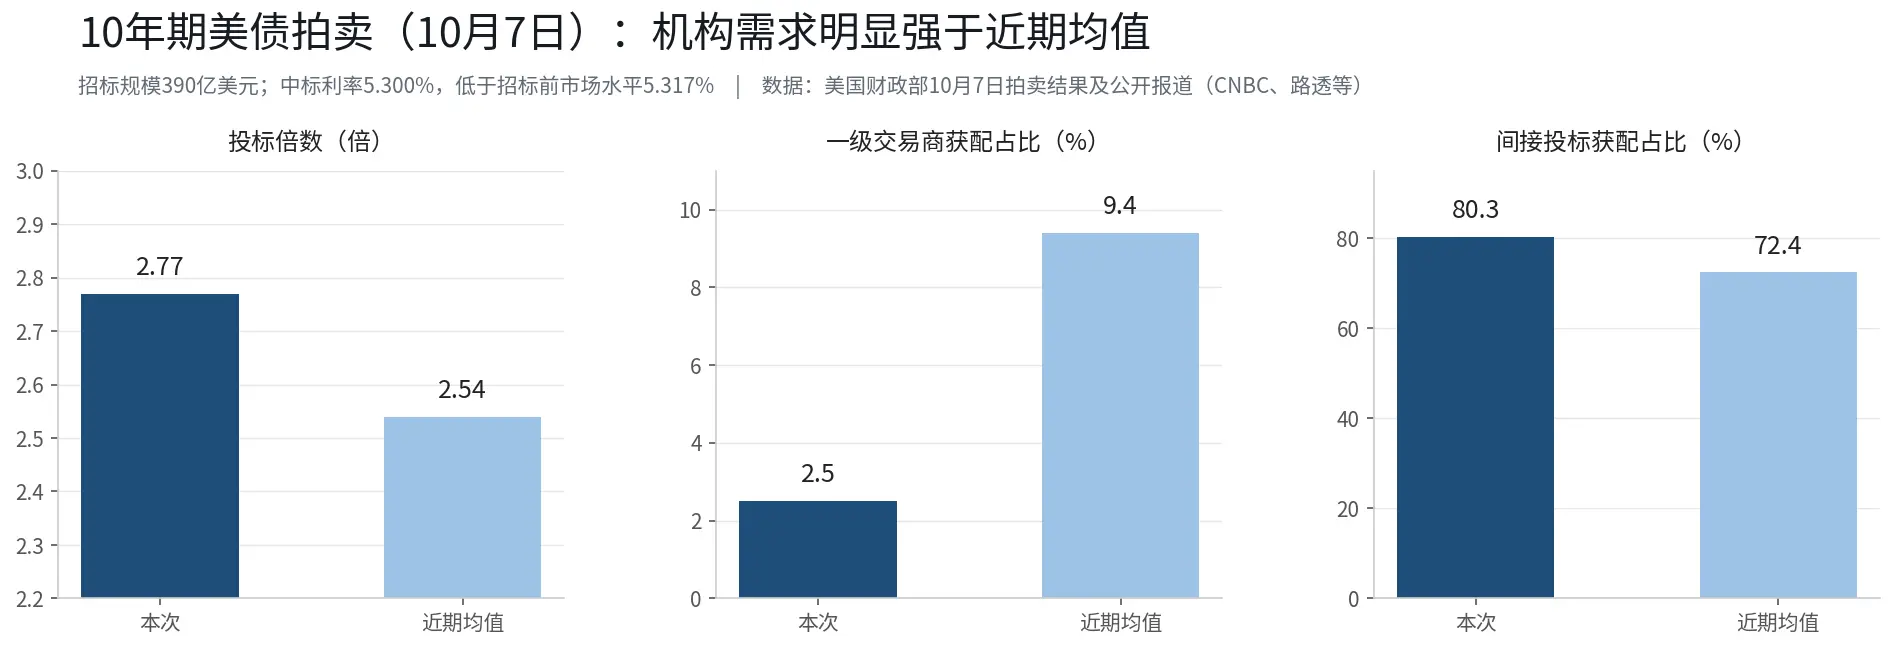
In the auction data, the bid-to-cover ratio of 2.77 indicates "strong demand," but the number 2.5% reveals where the demand came from: primary dealers only took 2.5% of the issuance, the lowest since the financial crisis—this indicates that the demand was not supported by market makers but was directly taken by real capital allocation; indirect bids (including global central banks and other institutions) received 80.3%, significantly higher than the recent average of 72.4%.
The decision-making logic of this type of capital differs from trading positions: pension funds, insurance, and sovereign funds have discipline regarding yields; they allocate when yields are high enough. For them, 5.3% is a calculable return not seen in years.
The judgment of this article is: if this buying continues, the peak of long-term yields may be closer than currently priced; if it is just a one-time auction occurrence, the pressure on gold and growth stocks has not yet been relieved. The observation point to distinguish between the two is the $22 billion 30-year auction on October 8—where the issuance yield may reach the highest since 2000.
V. What to Watch Next
First, the results of the 30-year auction. If the 10-year is strong and the 30-year is weak, it indicates that long-term demand is only a repair in individual segments; both being strong would indicate "capital allocation returning."
Second, the $4000 threshold. It is the next integer support; according to public reports, the People's Bank of China has continuously increased its gold holdings to 77.47 million ounces by the end of September, with official buying supporting from below, but it cannot change the upward direction of real interest rates.
Third, the December rate path. The December rate was fully priced in before the minutes were released; as long as there is one inflation data point that exceeds expectations, yields may test previous highs again; conversely, any signal of cooling inflation will simultaneously improve the situation for both gold and long bonds.
In Conclusion
Reading last night as "gold crashed" or "U.S. Treasuries stabilized" is incomplete. What actually happened yesterday was: yields pressured gold prices to the lowest level since August during the session, only to be pushed back by an auction with demand exceeding expectations. Gold prices are a thermometer; the auction is the adjustment mechanism. In the coming days, watching the 30-year auction and CPI will be more useful than looking at the daily K-line of gold prices.
Data Explanation
Data as of October 8, 2026, source: public market data, U.S. Treasury, Federal Reserve, CNBC, Reuters, etc.
Gold: London gold closed at 4110.68 on 10/7 (-1.28%), with an intraday low of 4066.36; it rebounded to around 4130 during the Asian session on 10/8.
U.S. Treasuries: 10Y broke 5.34% intraday (new high since April 2002, range 5.34%--5.37%), 30Y reached 5.728%, and 10Y closed around 5.3%.
10Y auction: $39 billion, awarded at 5.300% (expected 5.317%); bid-to-cover ratio of 2.77 (average 2.54); primary dealers took 2.5% (lowest since the financial crisis); indirect bids at 80.3%.
FOMC Minutes: Meeting on 9/15--16, released on 10/7; raised rates by 25bp to 3.75%--4.00%; most officials believe there may be one more hike this year; AI infrastructure listed as an inflation risk. Futures pricing for October was about 19%, fully priced for December.
Others: Dollar index around 102.3, breaking through the year's high; People's Bank of China gold reserves at 77.47 million ounces by the end of September, continuously increasing.
Disclaimer: The content of this article is for general information and market commentary only, compiled based on publicly available information as of the time mentioned in the text. Relevant market data, expectations, and probabilities may change with market conditions. The views and investment strategies of third-party institutions, analysts, or other individuals cited in the text represent the views of those third parties at a specific time and do not represent the views or recommendations of BIT. This article does not constitute investment advice, investment research, an offer, solicitation, or recommendation for any securities, investment products, or trading strategies, nor should it be the basis for any investment decision. Financial markets involve risks, and securities prices and market performance may fluctuate; past performance and historical market trends do not represent or guarantee future results. Investors should independently assess the relevant risks based on their own circumstances and seek professional advice when necessary.
 Risk warning



Popular articles