OpenAI's annual revenue is about 20 billion dollars less than previously reported, while NVIDIA lost about 170 billion dollars in one day
Introduction: On October 8, the U.S. stock market appeared to show index divergence, with the Dow Jones up 0.10%, the S&P 500 down 0.47%, and the Nasdaq down 1.25%. In reality, three pricing events occurred on the same day: within the AI industry chain, the market was repricing the true value of each segment; in the energy sector, geopolitical factors provided a premium; in the bond market, long-term buyers returned. Viewing these three events together provides more information than looking at any single index.
1. First, look at the market: Divergence is not in the index, but between sectors
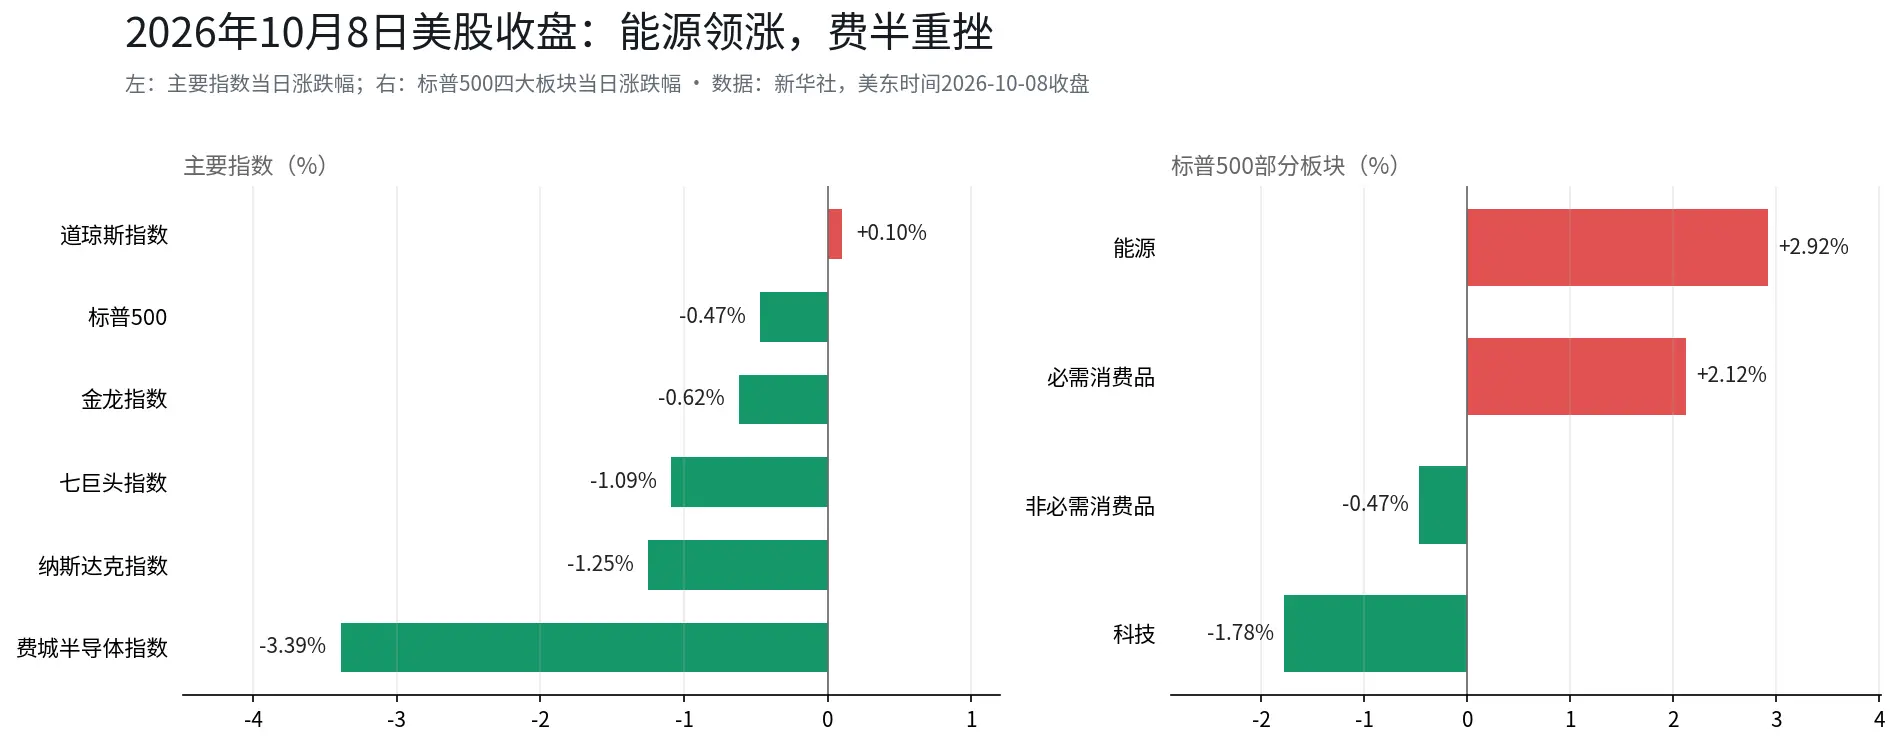 The S&P 500's eleven sectors saw six gain and five decline. Energy rose 2.92% to lead the gains, and consumer staples rose 2.12%; technology fell 1.78% to lead the declines, and consumer discretionary fell 0.47%. The Dow Jones index rose 51.77 points to 51,231.64 points, while the Nasdaq index fell 345.35 points to 27,193.34 points. The index of the seven major U.S. tech companies fell 1.09%.
The index level only fell by less than 1.3%, while the gap at the sector level approached 5 percentage points. This structure tells us that the objects being sold off that day were very concentrated: the market did not fully retreat from risk assets; it made a clear rebalancing between AI and energy. Apple rose 1.11% against the trend, being the only major stock among the seven that closed in the green; Amazon fell 2.25%, and Microsoft fell 1.35%.
2. $50 billion vs. $70 billion: The market is retracting an unconfirmed number from the company
According to the Financial Times, OpenAI recently disclosed to investors that its annualized revenue was close to $50 billion as of the end of September, lower than the approximately $70 billion reported by the newspaper and other media at the end of last month. How did this $20 billion gap arise? Investors adjusted OpenAI's revenue to directly compare it with Anthropic's figures, where Anthropic includes sales generated through cloud partners like AWS and Google Cloud in its revenue; after adjustment, the annualized revenue for August was estimated at about $40 billion. Combined with the company's disclosure of revenue growth exceeding 70%, this led to the $70 billion estimate. OpenAI's own documents state it is close to $50 billion.
Strictly speaking, this was not OpenAI lowering its performance; rather, the market had previously cited a number that included estimation components. However, the market's reaction to this issue indicates that the problem has gone beyond the statistical level. Reuters described it as "below previously released signals," and several media outlets on the same day compared the declines of NVIDIA, Oracle, and AMD alongside this disclosure.
Why is this number important? It depends on its position in the entire reasoning chain. Over the past two years, the starting point for AI capital expenditure reasoning has been the high growth of revenue from large model companies, leading to the conclusion that demand for computing power continues to explode, chip orders are full, and capital expenditure continues to expand. When the first link's number changes from $70 billion to $50 billion, every subsequent demand estimate must be recalculated. A comparable magnitude: OpenAI's annualized revenue of close to $50 billion is even lower than NVIDIA's data center revenue for the second quarter of fiscal year 2027 ($89 billion, according to the company's financial report). The market's previous pricing of the entire chain implied the assumption that the revenue side would quickly catch up with the expenditure side; after the revenue side's reading was revised down, the timing for this assumption to materialize has been pushed further back.
The chief market strategist at Miller Tabak Asset Management articulated the market's common question: In the context of significantly rising borrowing costs, how long can such large-scale AI spending be sustained?
3. Selling pressure transmits along the industry chain: first the periphery, then the core
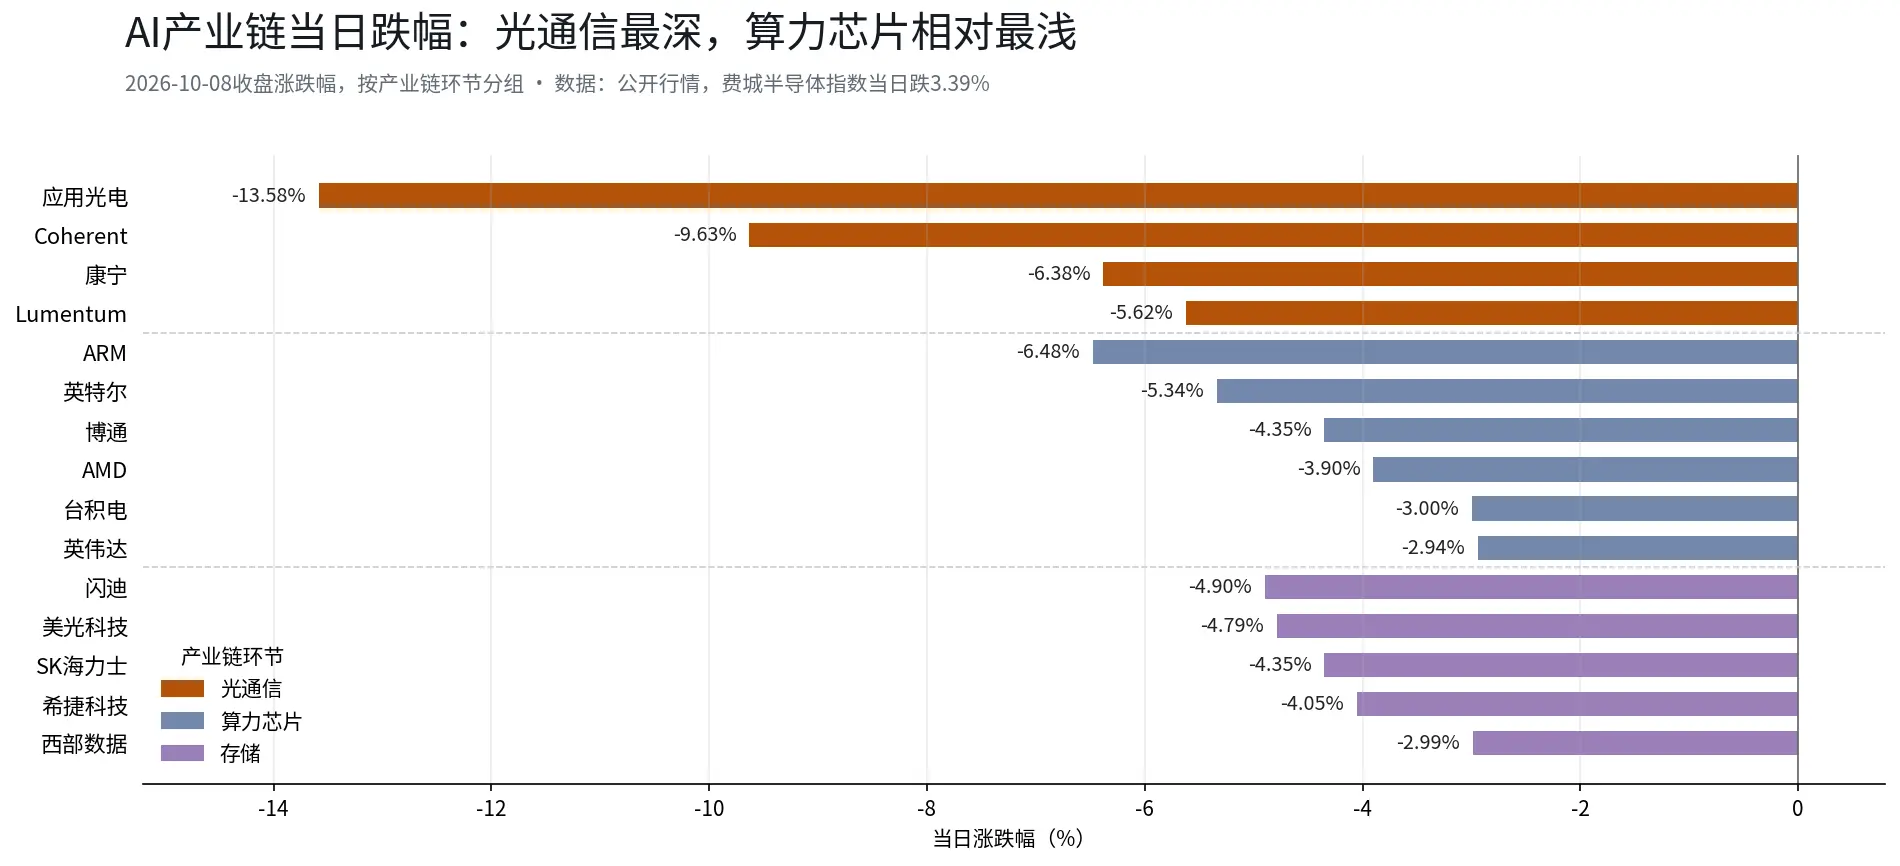
The concerns triggered by OpenAI's revenue disclosure had the most direct impact on semiconductors. The Philadelphia Semiconductor Index consists of 30 leading chip companies listed in the U.S., including NVIDIA, AMD, TSMC (ADR), Intel, and Broadcom. Retail investors usually do not pay attention to this index, but it is often used as a barometer for the global chip market. On that day, the index fell 3.39% to 12,623.72 points, with only 1 of the 30 constituent stocks rising. ARM fell 6.48%, Intel fell 5.34%, Broadcom fell 4.35%, AMD fell 3.90%, Micron fell 4.79%, TSMC fell 3.00%, and NVIDIA fell 2.94%. The largest weighted stock, NVIDIA, actually fell the least among the large chip stocks; even so, its market value still shrank by about $170 billion in one day (based on a closing market value of $5.58 trillion and a decline of 2.94%).
The internal order of the industry chain also needs to be examined separately. The decline in optical communication was significantly greater than that of computing power chips: Applied Optoelectronics fell 13.58%, Coherent fell 9.63%, Corning fell 6.38%, and Lumentum fell 5.62%. The storage segment was in the middle: SanDisk fell 4.90%, SK Hynix fell 4.35%, Seagate fell 4.05%, and Western Digital fell 2.99%.
The segments furthest from revenue realization fell first; this order itself is pricing information. Revenue from optical modules and optical devices is highly dependent on the construction pace of cloud vendors and data centers, representing derived demand from capital expenditure; computing power chips hold orders and pricing power, making their revenue visibility higher. When the market sells off, it first sells off the segments with lower visibility, only later moving to core holdings. This is different from panic liquidation; it is more akin to a step-by-step investigation based on whether each segment can be verified by financial reports.
4. Energy and oil prices: Geopolitical premiums have not fully retracted
Energy was the only safe haven that day. The S&P 500 energy sector rose 2.92% to lead the market, while oil prices briefly rose over 5%: Light crude oil futures for November delivery in New York peaked at $92.84 per barrel, up 5.17%; Brent crude peaked at $105.48 per barrel, up 5.27%. At the close, WTI was reported at $91.49 per barrel, up 3.64%; Brent was reported at $104.28 per barrel, up 4.07%.
The driving force behind geopolitical risks came from multiple simultaneous clues. The UK Maritime Trade Operations Office reported that a tanker was hit by multiple projectiles near Qatar, resulting in casualties; Kepler data showed that only 7 tankers passed through the Strait of Hormuz on the 6th, less than half of the average over the past 7 days, marking the lowest since July 23; from September 28 to October 4, a total of 10 tankers were attacked in the Strait of Hormuz.
Political signals are also changing. Trump stated that he is having "productive talks" with Iran and asserted that he would never attack Iran before the November 3 U.S. midterm elections; Iranian Foreign Minister Amir-Abdollahian confirmed that negotiations are ongoing, with parties exchanging information through mediators. Iran is reviewing the U.S. proposal to reopen the Strait of Hormuz within seven days and will respond in a few days.
The oil price narrowed from a rise of over 5% to about 4%; the narrowing of the increase without a retraction is a detail that carries meaning. The market has partially priced in the progress of negotiations while retaining a considerable geopolitical premium: there is still a long way between not launching attacks before the midterm elections and a long-term ceasefire. In other words, the strength of energy that day was supported by fundamental supply contraction, as well as event-driven premium components; once negotiations show substantial progress, this part of the premium will also retract quickly. Before treating energy as an alternative narrative to AI, both sides need to be considered.
5. U.S. Treasury auction and Waller's speech: Two signals that can be easily misread
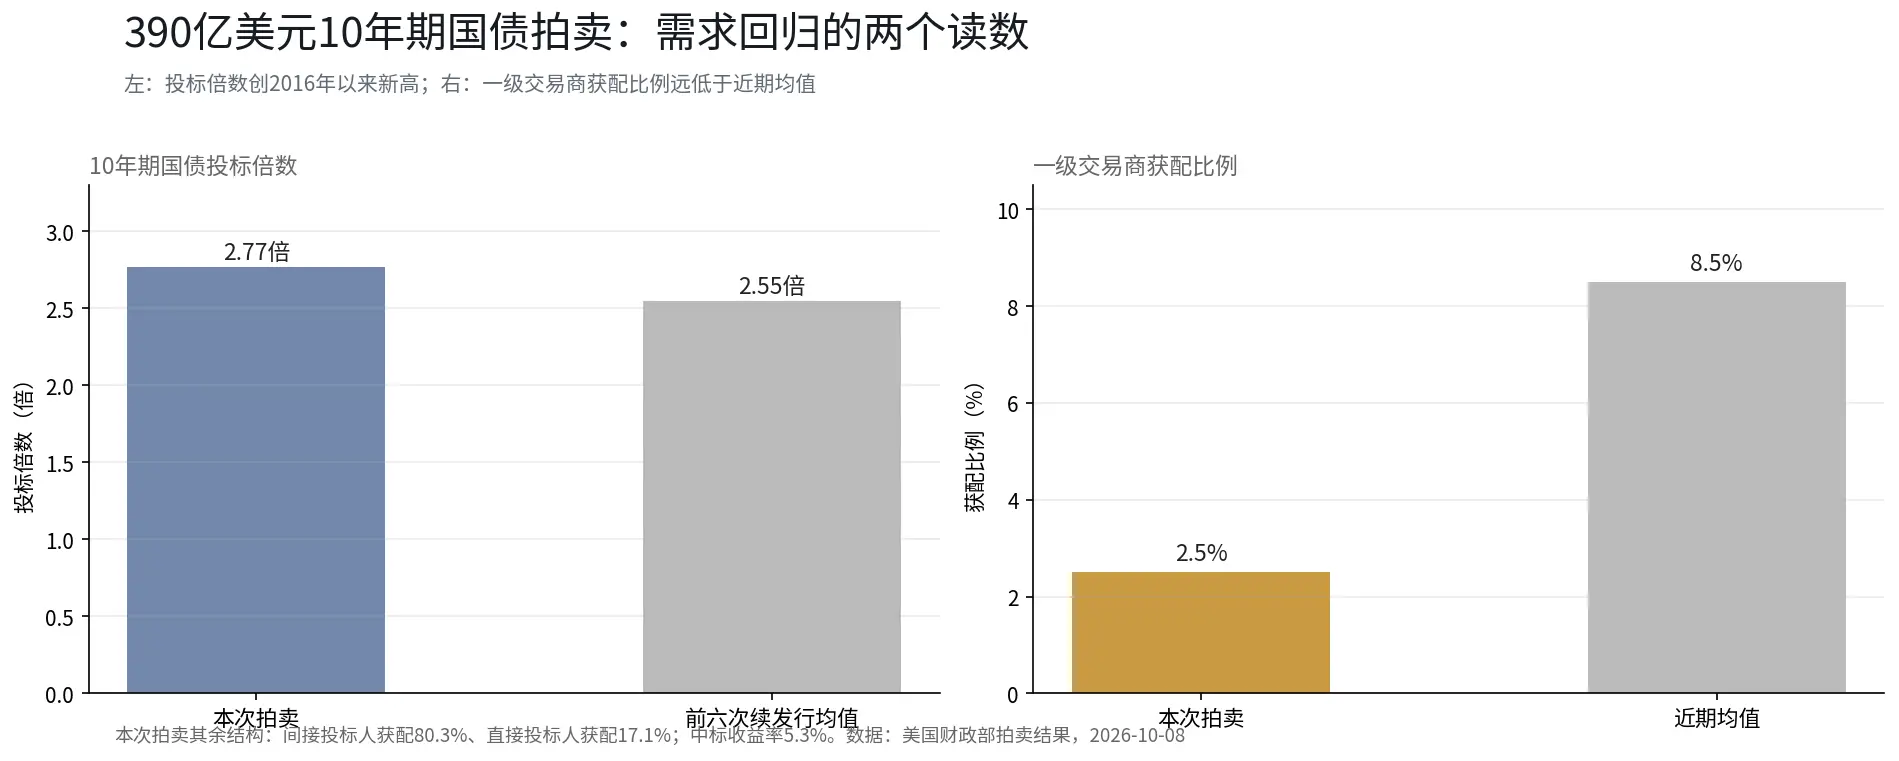
On that day, the U.S. Treasury issued $39 billion in 10-year bonds, with a winning yield of 5.3%, a bid-to-cover ratio of 2.77 times, the highest since 2016, significantly above the average of 2.55 times for the past six reissues. The allocation ratio for primary dealers was only 2.5%, far below the recent average of about 8.5%; indirect bidders received 80.3%, while direct bidders received 17.1%.
The 2.5% allocation for primary dealers is the most noteworthy number in this result. Primary dealers are the counterparties under statutory market-making obligations and are only forced to take up the bonds when other buyers are insufficient. A 2.5% allocation means the auction was almost entirely absorbed by final investors. The rate strategy team at Sumitomo Mitsui Banking Corporation stated that large investors with strong financial resources are beginning to find the current yield attractive, and some large investors are starting to cover short positions and gradually re-enter the market (as paraphrased from their public comments, this view represents the judgment of the relevant institution). The attitude of the head of U.S. rate strategy at Crédit Agricole is more cautious: it is too early to declare victory, but at least this is a start.
After the auction results were announced, the yield on 10-year U.S. Treasuries fell from an intraday high of 5.36% to around 5.28%, while the 30-year yield fell from 5.73% to 5.66%. On Thursday, there will be a $22 billion auction of 30-year bonds, with market expectations that the issuance yield may reach the highest since 2000. This time, the demand reading for the 10-year bonds is real, but whether it can continue will need to be verified by the 30-year auction. A single auction cannot change supply pressure; it changes the market's confidence that there are still real buyers for long maturities.
Federal Reserve Governor Waller stated at the Istanbul Economic Forum that if economic data meets expectations, the Fed may still need to raise interest rates further, but there is flexibility in the timing of rate hikes, and there is no need to act at consecutive policy meetings. His remarks on the sources of inflation contained the most information in the entire speech: the U.S. economy is strengthening, the impact of energy prices has not dissipated, and the construction of AI infrastructure is driving demand growth for key goods and services, making the necessity of raising rates increasingly evident. Listing energy shocks and AI investments as upward risks for inflation, alongside the previous day's Fed minutes stating that "AI could lead to mid-term total demand exceeding supply," indicates that the list of inflation factors the Fed is concerned about is getting longer. The pricing in the interest rate swap market shows that the likelihood of a Fed rate hike this month is about one in four, and another rate hike within the year has already been factored in.
Employment data supports this framework: last week, the number of initial jobless claims decreased by 2,000 to 197,000, the lowest since July, remaining below 200,000 for four consecutive weeks; the four-week moving average fell to 198,000, the lowest since early October 2022.
6. Chinese concept stocks: AI application end sold off first
Most Chinese concept stocks fell, with the Nasdaq Golden Dragon China Index down 0.62% and the Wind Chinese Technology Leaders Index down 1.11%. WeRide fell over 9%, Kingsoft Cloud fell over 5%, Pony.ai fell over 5%, and GDS fell over 3%.
The leading decline in the autonomous driving sector and the pressure on the AI sector are extensions of the same logic: the market is beginning to verify the revenue realization capability of AI, and the application end, which is furthest from revenue, was the first to be repriced. The declines of WeRide and Pony.ai are at different positions in the same investigation as the sharp drop in the optical communication sector.
Conclusion
Is OpenAI's annualized revenue $50 billion or $70 billion? The difference in the numbers themselves accounts for about 30% of the latter; what has truly changed is the market's verification method. Previously, the market was supported by a series of interrelated estimated numbers, but on that day, the market began to demand verifiable disclosures from each segment. The fact that only 1 of the 30 constituent stocks in the Philadelphia Semiconductor Index rose, and that optical communication fell before computing power chips, are traces left by this investigation. We believe that AI pricing may be shifting from narrative-driven to verification-driven; this transition may not be completed in one go, but evidence is accumulating in that direction. The performance of energy and U.S. Treasuries that day suggests that there is a place for fund rebalancing, but there is also a cost. As for the extent to which this transition has already been reflected in the market, it remains to be seen.
Data Explanation
Index, sector, individual stocks, Chinese concept stocks: Public market data, U.S. stock market close on 2026/10/8; indices and sectors according to Xinhua News Agency, some individual stocks verified through market data interfaces.
OpenAI annual revenue: FT 2026/10/8, Reuters, TechCrunch follow-up; NVIDIA data center revenue from company financial reports.
U.S. Treasury auction: U.S. Department of the Treasury, 2026/10/8; strategist opinions according to Financial Associated Press (Mitsui Sumitomo, Société Générale).
Waller's speech: Istanbul Economic Forum; interest rate swap probabilities based on same-day market data.
Crude oil and the Middle East: Xinhua Finance and public market data, 2026/10/8.
Initial jobless claims: U.S. Department of Labor, announced on 2026/10/8.
Disclaimer: The content of this article is for general information and market commentary purposes only, compiled from publicly available information as of the time mentioned in the text. Relevant market data, expectations, and probabilities may change with market conditions. The views and investment strategies cited from third-party institutions, analysts, or other individuals only represent the views of the relevant third parties at a specific time and do not represent the views or recommendations of BIT. This article does not constitute investment advice, investment research, an offer, solicitation, or recommendation for any securities, investment products, or trading strategies, nor should it be the basis for any investment decision. Financial markets carry risks, and securities prices and market performance may fluctuate; past performance and historical market trends do not represent or guarantee future results. Investors should independently assess relevant risks based on their own circumstances and seek professional advice when necessary.
 Risk warning



Popular articles