Bank of America’s Hartnett, who accurately predicted the major drop: the "sell signal" has ended, and investors will "return to tech stocks in mid-November," with a key focus on "chip prices."
 Core Viewpoint

 Although Bank of America’s “sell signal” has ended, this is by no means a signal to buy the dip. The Federal Reserve's restoration of credibility and the alleviation of concerns over AI financing, the two prerequisites for returning to risk assets, have not been fulfilled. Currently, the cracks in AI financing are widening, and tech stocks are extremely crowded. Strategists warn that whether we can return to tech stocks in November hinges entirely on the “semiconductor prices” as the decisive factor. The short-term recommendation is to temporarily avoid technology, maintain a defensive stance, and focus on small-cap stocks and REITs.
Author: Wall Street Insights
Bank of America Securities strategist Michael Hartnett previously accurately captured the significant drop in technology stocks, and his "sell signal" indicator has now been terminated. However, he clearly indicates that the termination of the signal does not equate to a buy signal; whether investors can return to technology stocks in mid-November will depend on the price trends of semiconductors, a key variable.
In the latest Flow Show report, Hartnett pointed out that the Bank of America Bull & Bear Indicator dropped sharply from 8.1 to 7.4, falling below the 8.0 threshold, officially ending the sell signal triggered on May 26. However, he tactically maintains a "defensive" stance and lists two prerequisites for returning to risk assets: the Federal Reserve raising interest rates on October 28 to restore credibility and alleviating concerns about AI financing—neither of which has been realized at present.
Market expectations for the probability of a Federal Reserve rate hike in October have plummeted from over 50% to 14%. The AI credit market has just experienced its worst week of the year: CoreWeave bonds have fallen into distress territory, with its 5-year CDS spread implying about a 63% probability of default; the Nasdaq 100 index saw a weekly decline of nearly 6%, marking its worst performance since "Liberation Day." Hartnett warns that if semiconductor prices fall, it will signal further tightening of AI credit and a peak in capital expenditure growth, at which point market returns in 2027 will shift from capital appreciation to income-driven.
Sell Signal Terminated, But Buy Signal Not Yet Triggered
The Bank of America Bull & Bear Indicator dropped sharply by 0.7 points to 7.4 this week, with contributing factors including: worsening breadth of global stock indices, hedge funds holding short positions in crude oil and S&P 500 futures, a reduction in long positions in gold futures, and weakening inflows into high-yield bonds and emerging market debt. The only counteracting factor pushing up was continued net inflows into technology stocks.
Hartnett also noted that the "old version" of the Bull & Bear Indicator fell from 5.6 to 5.1, below the recent high of 8.0 on September 1. Both versions convey a consistent message: the extreme optimism of summer has ended.
However, a cooling of sentiment does not mean that funds are truly withdrawing. The Bank of America breadth rule shows that 52% of global stock indices are in an "oversold" state (below the 50-day and 200-day moving averages), the highest since April 2025. But triggering a reverse buy signal requires the oversold ratio to reach a net 88%. Hartnett believes that unless the currently "overbought" stock markets in the U.S., Taiwan, and Brazil drop another 6% to 10%, it will be difficult to reach this threshold in the short term.
Positioning Remains Highly Crowded, Technology Stocks Overweight Hits Five-Year High
Although sentiment is cooling, the risk exposure in terms of fund allocation remains highly concentrated. The latest weekly data from EPFR (as of this Wednesday) shows net inflows into equity funds of $64.4 billion, bond inflows of $11.8 billion, and cash outflows of $53.1 billion—indicating that the sell-off in technology stocks has not left a significant mark in the flow data.
Currently, stocks account for a record 66.4% of the assets held by Bank of America private clients, while cash has dropped to a historic low of 9.3%. For the entire year, net inflows into global equity funds are projected to reach an annualized rate of $1.3 trillion in 2026, with technology funds at an annualized rate of $196 billion, more than 2.5 times the previous record. The Bank of America October fund manager survey shows that investors' overweight in technology stocks is at its highest level since August 2020.
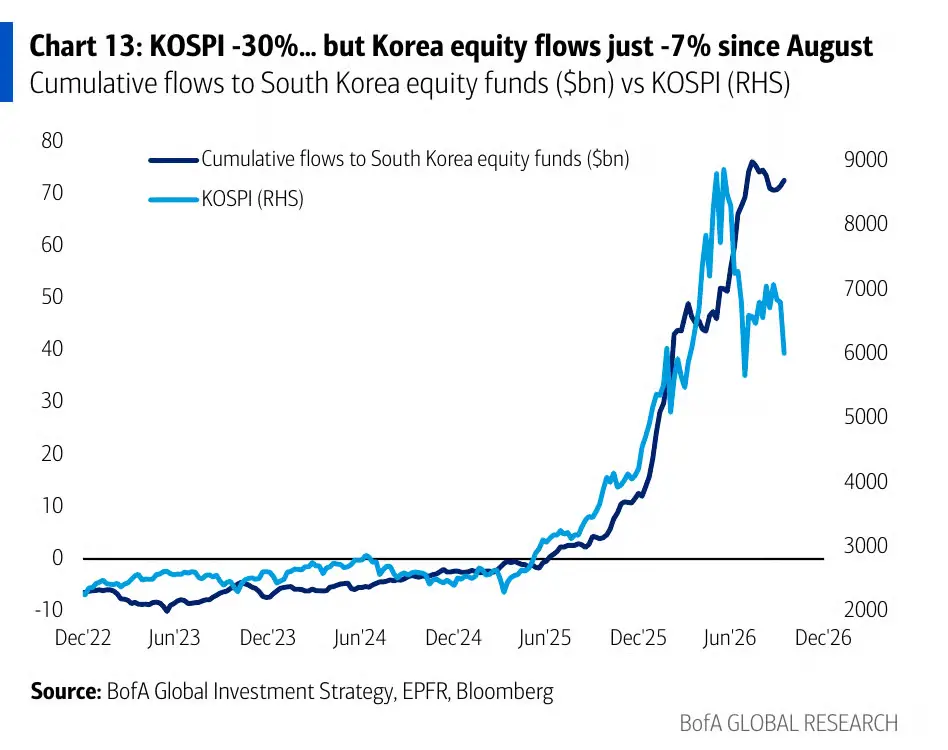
The South Korean market shows the most pronounced divergence between positioning and prices: the KOSPI has fallen 30% from its June peak, but since the August peak, only $7 has been withdrawn for every $100 that flowed in. Hartnett pointed out that foreign investors are the main force behind this week's sell-off, and the stock buyback window is also nearing closure, suggesting that real capital withdrawal may not have begun yet.
AI Financing Gap Widens, Real Yields Approach Warning Line
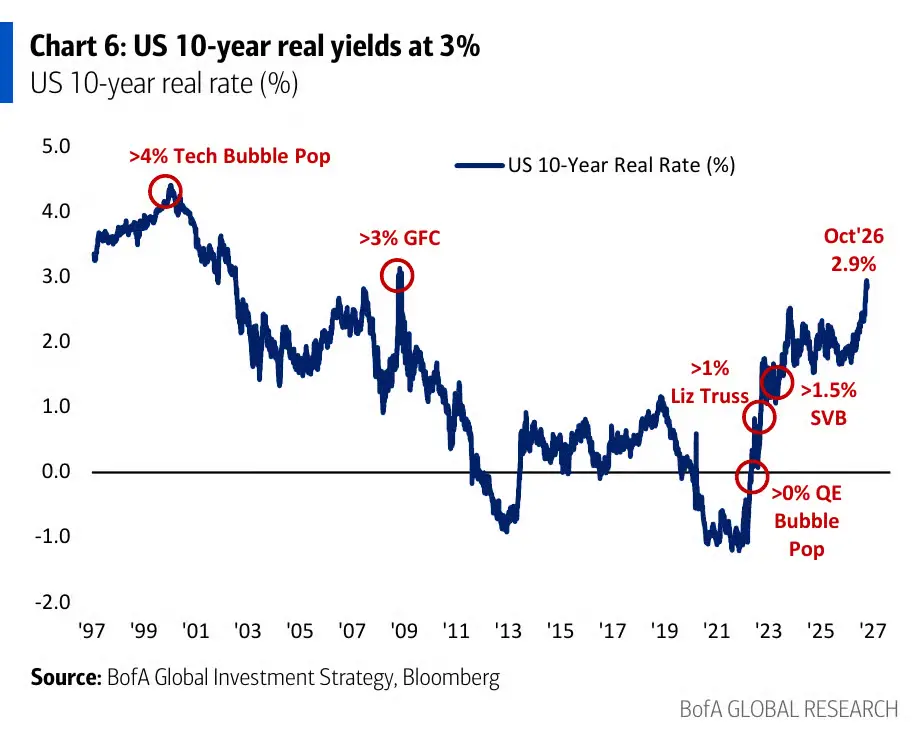
Hartnett currently maintains a defensive stance, based on three core reasons: First, the U.S. 10-year real interest rate is approaching 3%, a level that historically has been highly correlated with risk events such as the bursting of the tech bubble, the global financial crisis, and the SVB incident.
Second, private equity ETFs (PSP) and business development company ETFs (BIZD) have both fallen back to the lows of the first half of 2026. Third, Oracle's 5-year CDS has surged almost vertically, while the overall investment-grade tech bond spreads have remained virtually unchanged, indicating that the highest-leverage borrowers are under the most pressure.
According to Goldman Sachs interest rate strategist David Curtin, the cost of financing AI infrastructure is one of the main pressure sources in the current market— for borrowers below investment grade, the all-in financing cost of 6% to 8% "bites faster" in a high-interest-rate environment.
Goldman Sachs data shows that the spread on CoreWeave bonds maturing in 2031 once exceeded 1,100 basis points over U.S. Treasuries.
Market consensus data cited by Hartnett indicates that capital expenditure expectations for hyperscale cloud providers are projected to reach $807 billion in 2026 and climb to $1.16 trillion in 2027, while free cash flow is expected to turn negative by $63 billion this year and further expand to negative $163 billion next year. Goldman Sachs data also shows that the semiconductor producer price index has recently experienced a sharp increase after nearly 30 years of decline.
Chip Prices Become Key Variable for Market Direction in 2027
Hartnett presents the most critical forward-looking judgment of this cycle: the price trends of semiconductors will dominate the macroeconomic and market landscape heading into 2027.
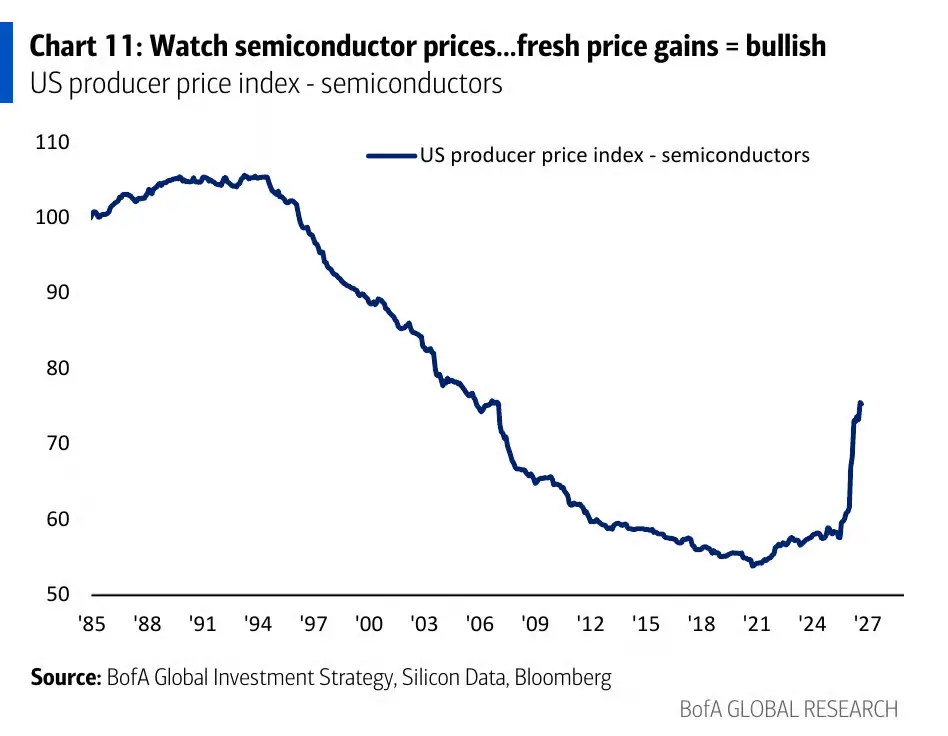
If chip prices maintain their upward trend, it would mean the ongoing AI arms race between the U.S. and China, and the expectation that the U.S. government provides implicit support for bond and stock prices would be sustained. Investors would return to technology stocks in mid-November and reverse their "short technology, long bonds" positions as they enter 2027.
Conversely, if semiconductor prices fall, it would indicate further tightening of AI credit, a peak in AI capital expenditure growth, and the underlying logic supporting the current nominal GDP boom would begin to unravel—U.S. nominal GDP has cumulatively grown by 63% from the COVID low to $33 trillion, with soaring chip prices being a significant driver. At that point, bond performance may prevail, and any assets priced based on the narrative of AI capital expenditure would face significant pressure, with the core driver of asset returns in 2027 shifting from capital appreciation to income.
Tactical Defense, Positioning in "Peak Yield" Beneficiary Sectors
In terms of specific operations, Hartnett chooses to increase allocations to assets benefiting from "peak yield," including small-cap stocks, REITs, and the consumer discretionary sector, which the Bank of America October fund manager survey shows has been the most underweight since July 2008. He clearly states that he will not increase positions in technology stocks for now.
In longer-term asset allocation, Hartnett maintains an overweight in gold, commodities, and emerging markets, while also indicating that long-term "short bonds" and underweight positions in China should be gradually reduced—this marks a clear shift in his stance.
Hartnett also points out through "price signals" that there are 355 constituent stocks in the S&P 500 index that are more than 10% below their 52-week highs, 188 that are down more than 20%, and 93 that are down more than 30%. Beneath the seemingly calm index, the damage at the individual stock level has been quite considerable, potentially creating a certain value space for patient investors seeking to find entry opportunities.

 Risk warning



Popular articles