Google plummeted 12.64%, while Eli Lilly reached a historic high, as the market begins to calculate the cash accounts of AI

1. Google Plummets 12.64%: The Faster AI Grows, the More the Market Worries About What?
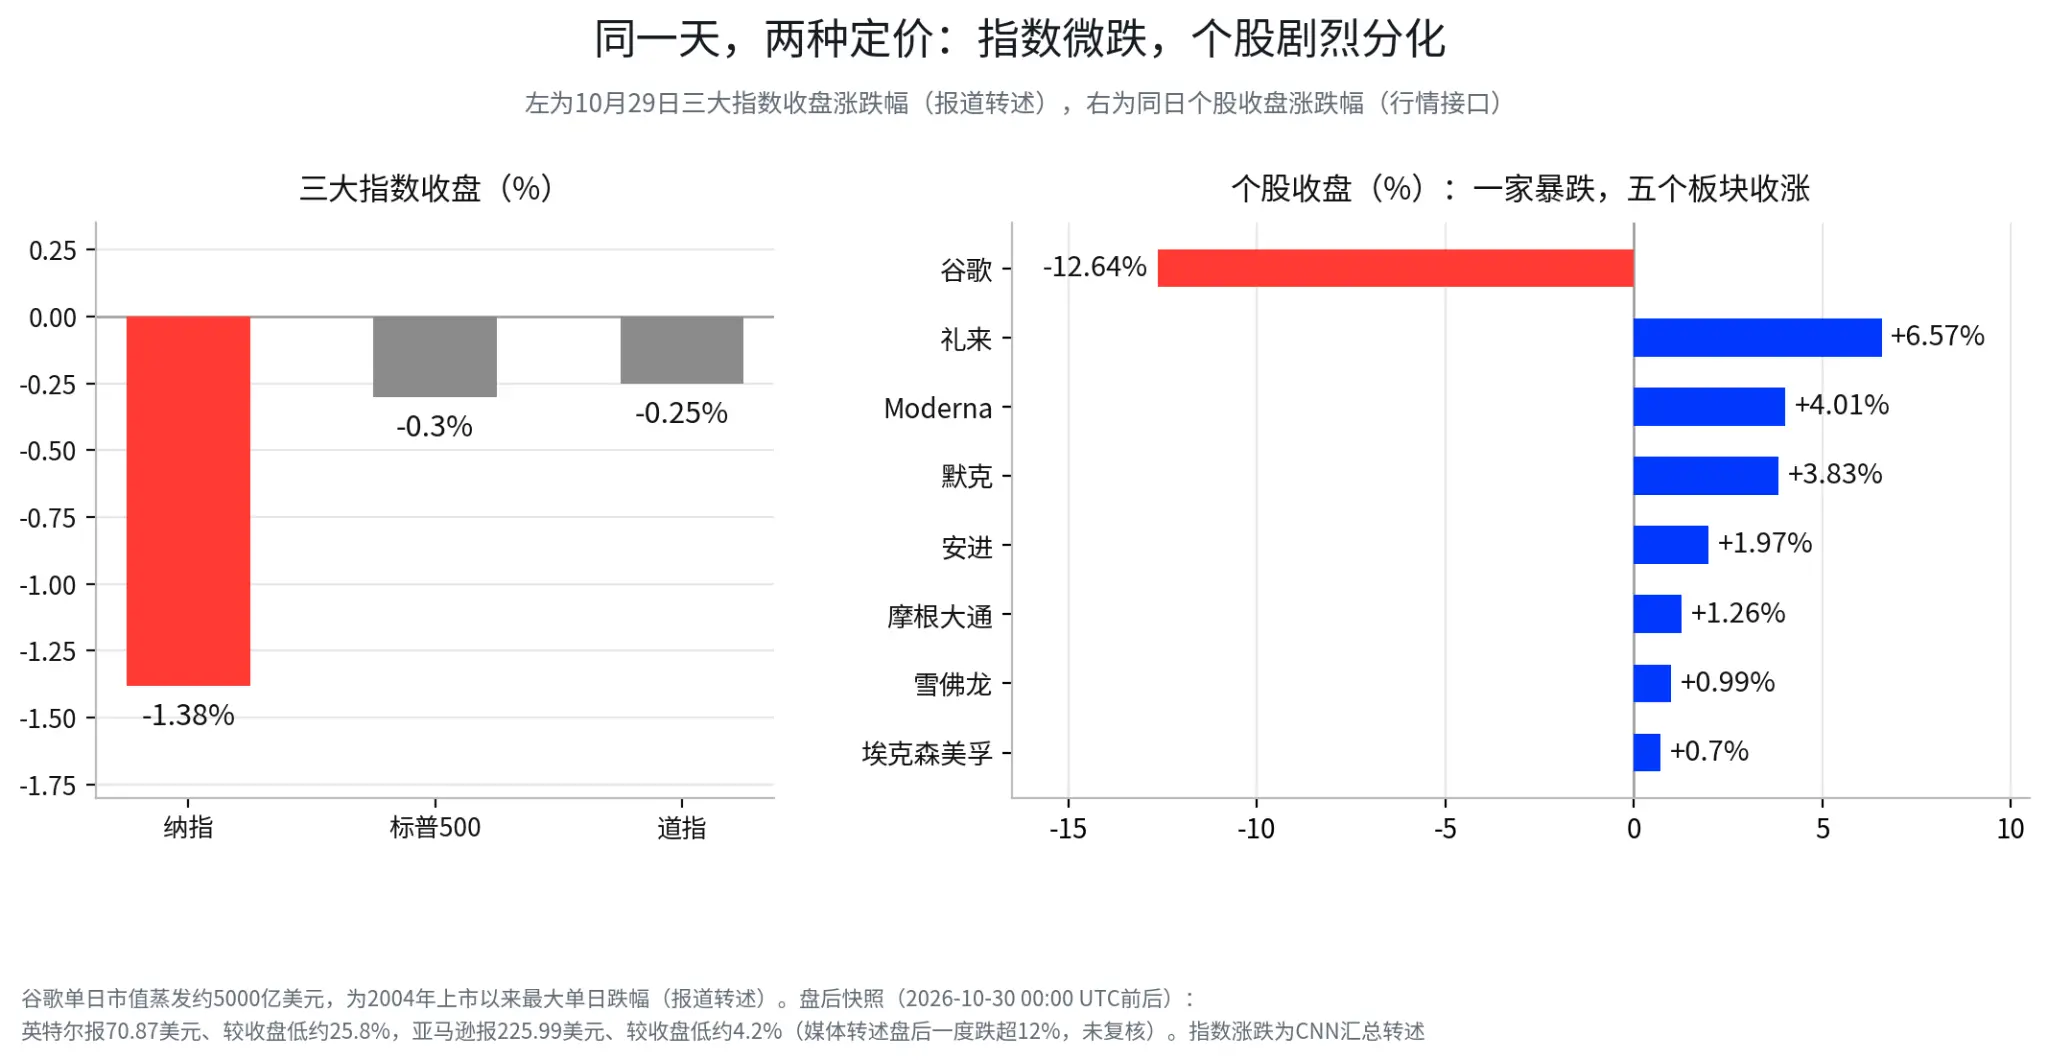
After the U.S. stock market closed on October 29, there was a noticeable divergence among individual stocks and sectors. Google closed down 12.64%, losing about $500 billion in market value in a single day, marking the largest single-day drop since its IPO in 2004 (reported by sources). Intel and Amazon subsequently released their earnings reports, and their after-hours stock prices also saw significant declines. In contrast to the weakness in tech stocks, Eli Lilly rose 6.57% to reach a historical high, with the healthcare, finance, and energy sectors generally closing up. On that day, the Nasdaq fell 1.38%, the S&P 500 dropped 0.30%, and the Dow Jones declined 0.25% (summarized by CNN), indicating that there was no widespread panic at the index level; rather, what changed was the market's judgment on the quality of earnings from different companies. Against the backdrop of expanding AI investment, the market began to care more about when these investments would translate into cash returns, a shift that permeated all trading on that day.
Google's earnings report was not bad in terms of revenue. In the third quarter, revenue reached $127.577 billion, a year-on-year increase of 25%, maintaining double-digit growth for the 13th consecutive quarter. Google Cloud revenue was $30.709 billion, a year-on-year increase of 103%, significantly exceeding market expectations. This indicates that enterprise demand for cloud computing and AI infrastructure remains strong, and there has been no significant cooling in the demand side of the AI industry chain. What truly disappointed the market was the slowdown in advertising revenue growth and the cash flow pressure resulting from continued capital expenditures.
The issue with the advertising business is that while users are increasingly using search, monetization has not kept pace. In the third quarter, search and other advertising revenue was $63.35 billion, a year-on-year increase of 12%, below the market expectation of nearly $65 billion, with growth slowing significantly from 17% in the previous quarter. Google also disclosed that the year-on-year growth rate of search volume has reached its highest level in nearly five years, indicating that users are not reducing their searches, but the growth in search volume has not translated into a proportional increase in advertising revenue. According to reports from The Economist and other media, some queries under AI models have lower ad monetization efficiency than traditional search results pages. As users gradually become accustomed to getting answers directly through AI, Google needs to address not only how to get more people to use AI but also how to maintain the commercial value of its advertising business under new interaction methods.
Compared to the slowdown in advertising growth, the cash flow pressure from capital expenditures is the core issue behind this decline. Google's capital expenditures in the third quarter reached $51.355 billion, a year-on-year increase of about 114%, exceeding the operating cash flow of $42.290 billion for the quarter, resulting in a net outflow of free cash flow of $9.065 billion, while the market had previously expected a slight net inflow of about $2.7 billion. More concerning is that this is not a one-time fluctuation. Google's free cash flow net outflow in the second quarter was $5.855 billion, compared to a net inflow of $24.461 billion in the same period last year, indicating that the cash flow gap is widening. Management also stated that capital expenditures will continue to exceed those of 2026 by 2027, but did not provide a clear timeline for peak investment or spending.
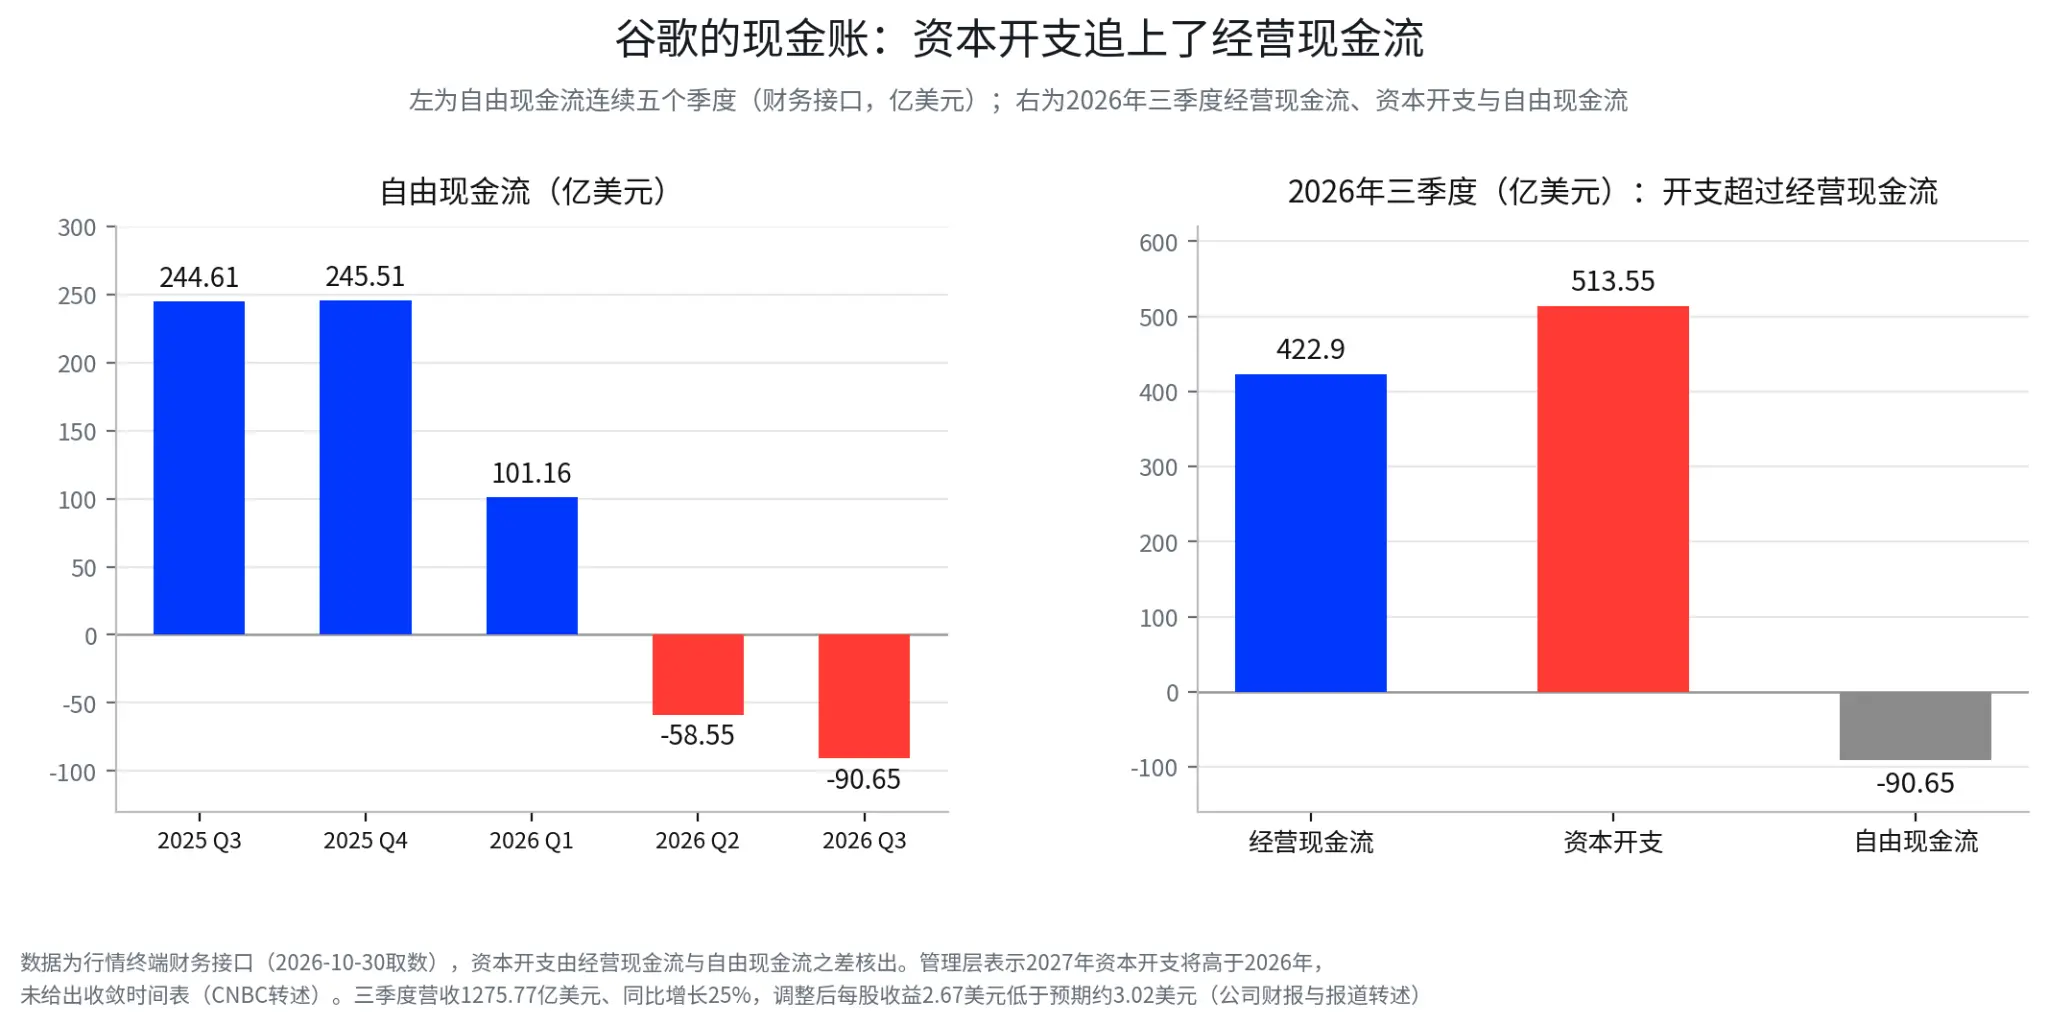
Increased capital expenditures are not inherently a bad thing. For cloud computing and AI infrastructure companies, building data centers, purchasing servers, and expanding network capabilities in advance are important means of competing for long-term market share. The key is whether the new investments can generate sufficient revenue and profit. If the cloud business continues to grow rapidly and profit margins improve with scale, then the current cash flow pressure may just be a temporary phenomenon in the expansion cycle. However, if capital expenditures consistently outpace operating cash flow, and the revenue growth from the cloud business fails to translate into corresponding cash returns, investors will need to reassess the company's future free cash flow and capital return rates. The valuation repricing that Google is experiencing is actually targeting the recovery cycle of AI investments, rather than the AI capabilities themselves.
2. Intel and Amazon: Both Down After Hours, but the Issues Behind Are Different
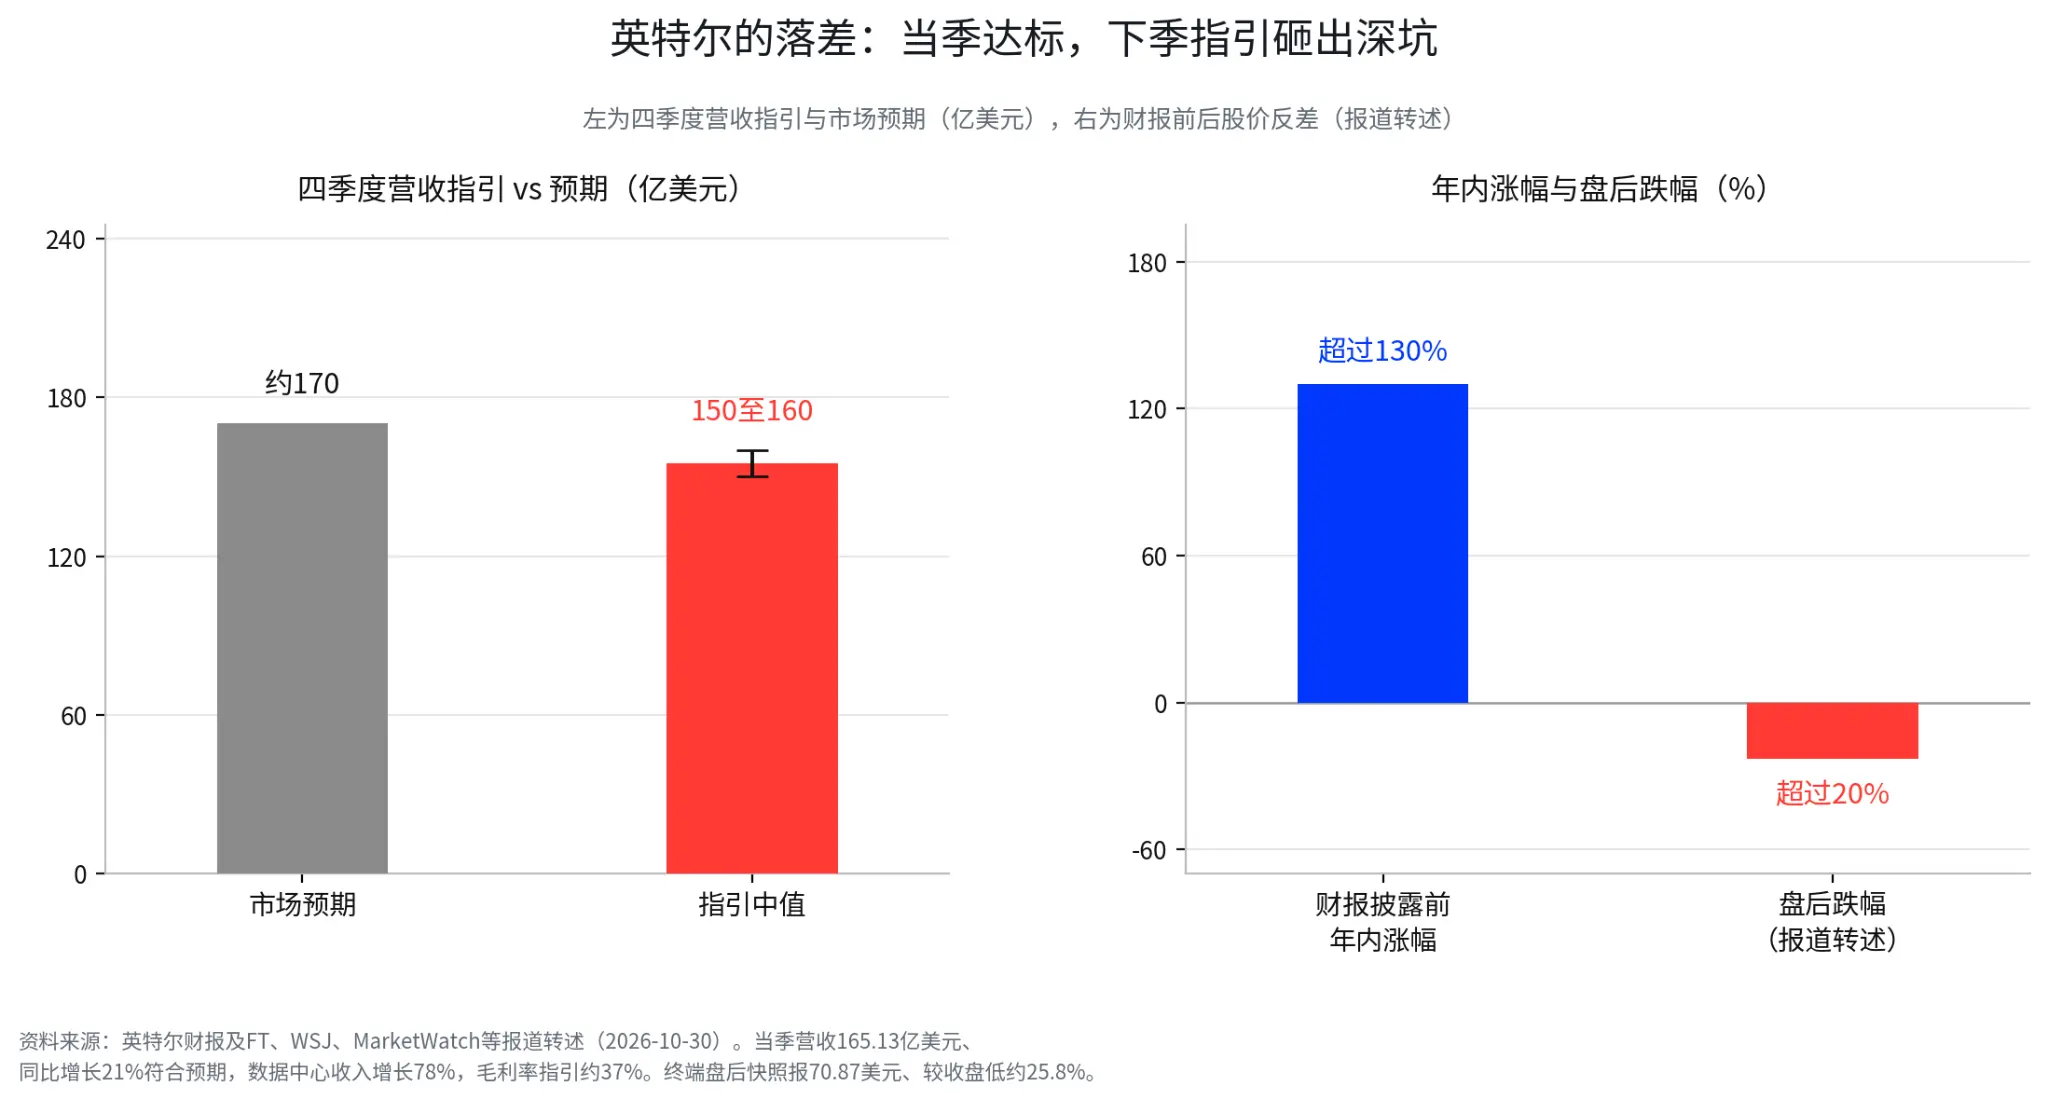
Both Intel and Amazon were weak after hours, but the pressures need to be viewed separately. Intel's stock fell over 20% at one point after hours, but the quarterly performance was actually not bad: third-quarter revenue was $16.513 billion, a year-on-year increase of 21%, with data center business revenue up 78%, indicating that demand for AI inference server chips is being realized. What truly pressured the stock price was the guidance for the fourth quarter: revenue is expected to be between $15 billion and $16 billion, below Wall Street's expectation of about $17 billion, with gross margin guidance lowered to 37%. Management explained that weak PC demand may continue into the first half of 2027, rising costs due to storage chip price increases, and the impact of an incident at the Israeli factory on fourth-quarter revenue of about $300 million.
The more critical issue is that expectations were too high. Before the earnings report, Intel's stock had already risen over 130% this year, and merely meeting expectations for the quarter was not enough; any guidance below expectations easily triggers profit-taking. After hours, the stock price fell over 20%, with a terminal snapshot at $70.87, about 25.8% lower than the closing price. Therefore, this decline seems more like a valuation adjustment due to guidance shocks combined with high expectations, rather than simply attributable to the repricing of AI capital expenditures. However, it also indicates that the market's tolerance for assets in the AI industry chain is decreasing: relying solely on the AI concept or future demand is no longer sufficient to obtain valuation premiums; companies must demonstrate actual performance and profit guidance.
Amazon's stock fell over 7% at one point after hours, facing the same capital return issues as Google, with pressure concentrated on revenue, cash flow, and capital expenditures. Total revenue for the third quarter was $201.9 billion, slightly below market expectations. AWS revenue was $46 billion, a year-on-year increase of 39.3%, higher than the previous quarter's 37%, but still below the expectations of some institutions for over 40%; holiday season sales guidance was also weak, leading to market doubts about short-term revenue growth. More critical than revenue is cash flow. Over the past 12 months, operating cash flow was $168.3 billion, a year-on-year increase of 29%, but free cash flow saw a net outflow of $42.4 billion. The gap between the two is almost entirely due to capital investments in data centers consuming operating cash.
Amazon has not scaled back its investments, maintaining its capital expenditure plan of $220 billion for 2026, with CEO Andy Jassy stating that spending will significantly increase in 2027. For investors, AWS still has strong growth momentum, but to achieve returns, substantial ongoing investment will be required. Revenue falling short of expectations, weak holiday guidance, negative free cash flow, and expectations of continued capital expenditure expansion constitute the main pressures following the earnings report. After hours, the stock price fell over 7%, with media reports indicating a drop of over 12% at one point, with a terminal snapshot at $225.99, about 4.2% lower than the closing price.
When looking at Google and Amazon together, the market's concerns have shifted. There is no issue with AI demand; the problem lies in the infrastructure construction potentially entering a phase of increasingly large investment scales with unclear recovery cycles. According to statistics from The New York Times and other media, the combined capital expenditures of Google, Amazon, Microsoft, and Meta this year will exceed $720 billion, about three times that of two years ago; three of the four companies have already seen their free cash flow turn negative, and Meta has also recorded its first quarter of negative free cash flow since its IPO. Both upstream and cloud service providers are expanding their investments, prompting the market to question: with such massive capital expenditures, how much return can ultimately be generated for shareholders?
3. Eli Lilly Hits Historical High: The Market Begins to Reprice for Cash Flow Certainty
While tech giants are busy explaining capital expenditures and investment returns, Eli Lilly delivered a completely different earnings report. The company reported third-quarter revenue of $24.397 billion, a year-on-year increase of 39%, exceeding market expectations of about $22.6 billion, with adjusted earnings per share of $7.48, also surpassing market expectations of $6.49. Core growth still comes from GLP-1 drugs, with global revenue from Mounjaro reaching $10.72 billion, a year-on-year increase of 65%, and Zepbound revenue at $5.35 billion, a year-on-year increase of 49%, with the two products contributing about 66% of quarterly revenue. As sales continue to exceed expectations, the company raised its full-year revenue guidance from the previous $85 billion to $87 billion to $91 billion to $92 billion, marking the third upward revision this year (company earnings report and media summary).
The difference between Eli Lilly and Google is not in growth rates, but in how that growth is realized. Google needs to invest hundreds of billions of dollars to build data centers and purchase equipment before gradually recouping costs through cloud services and AI products. Eli Lilly's core revenue comes directly from actual drug sales and prescription demand, with the company reporting a net inflow of free cash flow of $8.219 billion in the third quarter, with sales growth of 53%. Despite factors like Medicare access causing a net price decline of about 15%, the growth in sales is still sufficient to drive overall revenue growth of 39%. In a phase where the market is beginning to reassess corporate capital returns, Eli Lilly's business model, which can directly convert product demand into revenue and cash flow, naturally attracts more funding attention. 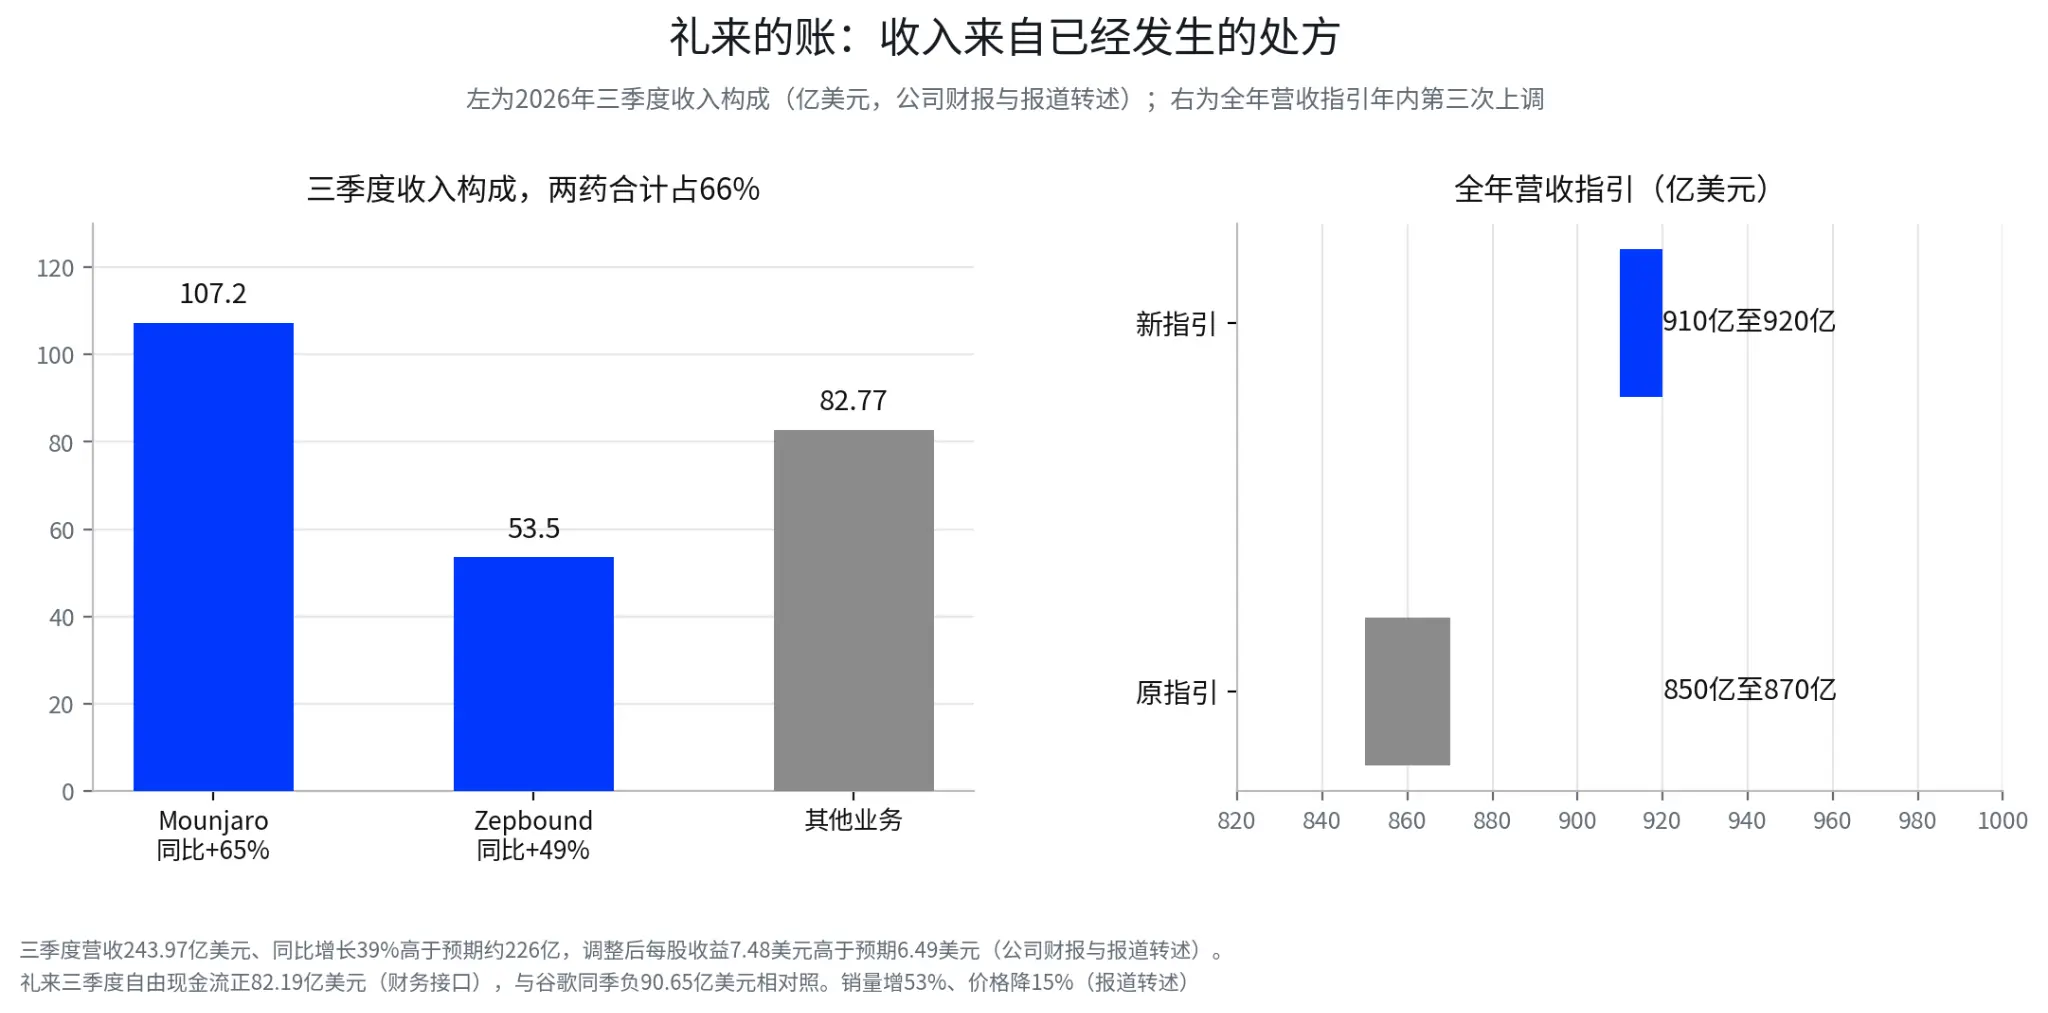
Of course, strong cash flow performance does not mean Eli Lilly is free from valuation risks. Previously, its rolling price-to-earnings ratio was estimated at about 45 times, which is not cheap; Medicare access may continue to pressure net prices, and competition in the weight loss drug market may also affect future market share. For investors looking to track Eli Lilly, it will be important to observe whether prescription volume and sales growth can continue, whether the decline in net prices begins to outpace sales growth, and whether revenue guidance and free cash flow can continue to corroborate each other. Especially after the stock price has already reached a historical high, it is essential not to chase short-term gains solely based on inflows into the healthcare sector, but to wait for volume-price data and earnings expectations to provide further support.
4. Funds Have Not Left the U.S. Stock Market, but Are Re-selecting Sources of Profit
The contrasting movements of Google and Eli Lilly are not just about two stocks; similar changes can also be seen at the sector level. On that day, the healthcare sector performed outstandingly, with Moderna rising 4.01%, Merck up 3.83%, and Amgen increasing 1.97%. Most financial stocks closed higher, with JPMorgan rising 1.26%. Energy stocks also saw slight gains, with ExxonMobil up 0.70% and Chevron up 0.99% (market interface). Brent crude and WTI remained around $114 and $102, respectively (reported by sources), but energy stocks did not experience a significant rise matching oil prices, indicating that the funds on that day were focused not only on geopolitical premiums but also on the operating cash flows that energy companies can already realize.
The ways of making money in healthcare, finance, and energy are different, but they share a common point: it is relatively easy to see where revenue and cash flow come from. Pharmaceuticals rely on drug sales and prescription demand, banks depend on interest spreads, trading, and credit, while energy relies on oil prices, production, and cost control. Each also has its own risks, such as banks fearing deteriorating credit quality, energy fearing falling oil prices, and pharmaceuticals fearing drug price and competitive pressures. However, compared to tech companies that are still massively expanding AI infrastructure, these companies have clearer paths to profit realization. In a phase where investors are re-emphasizing current cash flow, this "clarity" itself will attract funds.
Institutional fund data also provides corroborating evidence. Goldman Sachs' position tracking shows that hedge funds increased their holdings in the healthcare sector by $1.69 billion over the past two weeks while reducing their positions in semiconductors. EPFR data indicates that in the last two weeks, U.S. healthcare-themed funds saw a net inflow of $4.72 billion, with the inflow strength at a relatively high level this year. However, the inflow over the two weeks is still insufficient to prove that the market has shifted from technology to healthcare in the long term. A more reasonable understanding is that institutions are increasing their allocation to sectors like healthcare, where profits are relatively visible. Moving forward, it will be important to see if healthcare funds can continue to attract capital and whether the reduction in semiconductors will further expand. Baird strategists share a similar view: fluctuations in the AI narrative do not mean that the growth logic of the entire market has been disrupted; capital may spread from a few giants supported by high capital expenditures to assets with more diversified profit sources.
Therefore, the current market situation should not be simply understood as a "funds battle between AI and non-AI." AI demand remains strong, with Google Cloud revenue growing by 103% and Amazon AWS by 39.3%, indicating that enterprises' demand for cloud computing and AI computing power has not disappeared. The change lies in the market beginning to distinguish between "industries with demand" and "enterprises that can make profits." Computing power suppliers can generate revenue from orders and product sales, but that does not mean all cloud service providers can recover the costs of building data centers in the short term. In the future, companies that can continuously obtain valuation premiums are more likely to be those that can prove their investments ultimately turn into profits and free cash flow, rather than just the companies with the largest AI investment scale.
5. The next three nodes will determine how the market continues to filter AI assets
For investors, tracking the next three time nodes that can validate market judgments is currently more valuable than guessing when Google will rebound. The first is Nvidia's earnings report in mid-November, which will directly test whether AI computing power demand remains strong. Key indicators to watch include data center revenue, orders and delivery status, and whether gross margins can remain stable. If revenue and orders continue to exceed expectations, it indicates that the demand for AI infrastructure is still supported, and the profit expectations for the computing power supply chain are unlikely to be quickly revised downwards. However, if order growth slows significantly or gross margins are affected by product mix and competitive pressure, the market may further lower its expectations for AI hardware growth. Nvidia's performance exceeding expectations does not automatically resolve the investment return issues for cloud giants; the profitability of computing power suppliers and the capital expenditure recovery for cloud service providers remain two different financial issues.
The second node is the next round of capital expenditure guidance from cloud giants, which may be more important than mere revenue growth. For Google, Amazon, Microsoft, and Meta, investors need to observe capital expenditures, cloud business revenue, operating profit margins, and free cash flow together. If cloud revenue continues to grow, capital expenditure growth slows down, and operating cash flow begins to better cover investment expenditures, it indicates that AI infrastructure construction may be transitioning from the investment phase to the return phase, and tech stocks may regain valuation support. Conversely, if companies continue to raise capital expenditure plans while cloud business growth does not improve in tandem, and the free cash flow gap further widens, then even if stock prices rebound, it cannot be concluded that valuation pressure has been alleviated.
The third node is the Federal Reserve's interest rate meeting on December 9, which will affect the relative valuation of cash flows of different durations. When interest rates remain high, profits that can only be realized years later are relatively discounted to today's value, making high-valuation growth stocks that rely on future returns more susceptible to pressure, while companies with relatively stable earnings and dividends may gain a relative advantage. At that time, it will be necessary to combine the interest rate decision, dot plot, Powell's speech, and changes in U.S. Treasury yields to assess whether the cost of capital will continue to rise. However, a rate cut does not necessarily benefit tech stocks; if the cut is triggered by a rapid economic downturn, corporate revenue and profit expectations may be adjusted downward simultaneously, and valuation improvements may not offset the deterioration of fundamentals.
6. What directions and indicators is the market focusing on?
From a directional perspective, the current observation scope can be divided into three groups. The first group is AI infrastructure and cloud computing leaders, focusing not just on the extent of stock price corrections but on verifying computing power demand and capital returns. Nvidia and AMD should primarily observe orders, data center revenue, and gross margins, while cloud giants need to track cloud business revenue growth, profit margins, capital expenditures, and free cash flow. The second group is healthcare assets, with a focus on the prescription volume, net prices, and annual guidance of GLP-1 products; other pharmaceutical companies need to assess the sustainability of profits based on their respective product pipelines and sales performance. The third group is financial and energy assets, where JPMorgan Chase needs to track net interest margins, credit losses, and trading revenue, while traditional energy companies should focus on oil prices, production, capital discipline, and free cash flow.
These directions are not suitable for simple categorization as the same type of defensive allocation. Eli Lilly still faces valuation and competitive risks, banks need to deal with the credit cycle, and energy companies are affected by oil price fluctuations. A more reasonable approach is to establish an observation list based on each sector's profit drivers and assess whether it is worth increasing allocation weights in conjunction with earnings reports and changes in capital flows.
|----------|---------------------------|-----------------| | Observation Direction | Key Targets and Indicators | Changes to Validate | | AI Computing Power | NVDA, AMD: Data center revenue, orders, gross margins | Can computing power demand and profit growth be maintained? | | Cloud Computing | GOOGL, AMZN, MSFT: Cloud revenue, operating profit margins | Can cloud business growth translate into profits? | | Capital Expenditures | Four major cloud giants: Capital expenditures, operating cash flow, free cash flow | Investment growth slows, cash flow gap narrows | | Healthcare | LLY, MRK, AMGN: Prescription volume, net prices, revenue guidance | Can sales growth offset price pressure? | | Financial | JPM: Net interest margin, credit losses, trading revenue | Is profit growth stable with asset quality? | | Energy | XOM, CVX: Free cash flow, production, oil prices | Can commodity prices translate into sustained cash returns? | | Macro | U.S. Treasury yields, inflation, FOMC guidance | Will the cost of capital continue to rise? |
Overall, the core change in this market cycle is that investors are beginning to raise their expectations for AI commercial returns; capital has not abandoned AI. As long as computing power demand continues to grow, the long-term investment opportunities in the AI industry will not disappear due to one or two earnings reports. However, for companies with continuously expanding capital expenditures and no improvement in cash flow, the market may no longer be willing to grant high valuations based solely on future growth stories. In contrast, sectors like healthcare, finance, and energy, which have relatively clear profit paths, may continue to attract capital attention. What is truly worth tracking next is who can first turn these investments into profits and free cash flow, rather than just who announces larger AI investment plans.
Data Explanation
Google: Market and financial interface, October 30, 2026. Closed at $283.82, down 12.64%, market cap $3.46 trillion, evaporating about $500 billion based on the interface. Q3 revenue $127.577 billion, operating cash flow $42.290 billion, free cash flow negative $9.065 billion, capital expenditures $51.355 billion derived from the difference between two periods. Earnings per share, AI model monetization efficiency, etc., are reported from earnings reports and relayed by CNBC and The Economist.
Intel: Reports from FT, WSJ, etc., relayed, October 30, 2026. Q3 revenue $16.513 billion, up 21%, in line with expectations, data center up 78%, Q4 guidance $15 billion to $16 billion, below the expected $17 billion, gross margin guidance 37%. After-hours snapshot $70.87, down 25.8% from the close.
Amazon: Reports relayed, October 30, 2026. Revenue $201.9 billion slightly below expectations, AWS $46 billion up 39.3%, TTM free cash flow negative $42.4 billion, 2026 capital expenditures $220 billion. After-hours snapshot $225.99, down 4.2%, at one point down over 12% without verification.
Eli Lilly: Market and financial interface. Closed at $137.3, up 6.57%, hitting a new high, market cap $1.29 trillion. Q3 revenue $24.397 billion, up 39%, earnings per share $7.48 (GAAP $7.23), free cash flow $8.219 billion, guidance raised for the third time this year to $91 billion to $92 billion.
Sectors and capital flows: Individual stock fluctuations are market interface, indices are relayed by CNN. Goldman Sachs' position tracking and EPFR healthcare fund inflows are relayed institutional data.
The four giants' capital expenditures this year exceeded $720 billion, three companies turned negative free cash flow: relayed by The New York Times, etc. Brent around $114, WTI around $102, reported relayed on October 29.
Disclaimer: The content of this article is for general information and market commentary purposes only, compiled based on publicly available information as of the time mentioned in the text; relevant market data, expectations, and probabilities may change with market conditions. The views and investment strategies quoted from third-party institutions, analysts, or other individuals only represent the views of the relevant third parties at a specific time and do not represent BIT's views or recommendations. This article does not constitute investment advice, investment research, an offer, solicitation, or recommendation for any securities, investment products, or trading strategies, nor should it be the basis for any investment decision. Financial markets carry risks, and securities prices and market performance may fluctuate; past performance and historical market trends do not represent or guarantee future results. Investors should independently assess the relevant risks based on their circumstances and seek professional advice when necessary. BIT's Hong Kong stock trading services are not available to residents of Hong Kong or users in other restricted jurisdictions.
 Risk warning Risk warning




Popular articles