Microsoft surged, Google plummeted, and storage stocks rose broadly: AI trading begins to question when the money will come back?
 Indicators worth continuous tracking include changes in storage prices and long-term contracts, Microsoft and Google's capital expenditures and cash flow for the next quarter, Oracle's progress towards positive cash flow in the second half of fiscal year 2028, and whether the demand for robotic memory can transition from industry forecasts to actual orders.
Introduction: On October 28, the U.S. stock market provided several distinctly different answers regarding AI. After Microsoft released its earnings report, its stock price briefly rose over 6%, then the gains receded; Google closed up 1.34%, but after the earnings report, it dropped nearly 10% in after-hours trading; Oracle did not release a new quarterly earnings report but saw its stock rise 10.58% that day due to updates on its operational and cash flow targets for the coming years. Meanwhile, the storage sector generally strengthened.
If we only compare growth rates, this set of market movements is not easy to explain. Microsoft's Azure revenue grew 48% year-over-year, while Google's Google Cloud growth rate reached 103%, yet Google, which has faster cloud business growth, faced a larger sell-off. Oracle's increase also indicates that the market's focus has extended beyond how much companies are investing to whether these investments can generate verifiable revenue, profits, and cash flow, and how long investors will have to wait.
The market has not suddenly lost confidence in AI, but the evaluation criteria are becoming more specific. Whether Microsoft's orders can support sustained expansion, when Google's business growth can translate into group cash flow, whether storage vendors can maintain profitability through supply constraints, and whether Oracle's promised cash flow inflection point will appear as expected—these questions are dividing the originally similar AI narratives into different valuation paths.
I. Microsoft: Azure growth supported by orders, but expansion costs are rising
In the first fiscal quarter of fiscal year 2027, Microsoft's revenue reached $92.28 billion, a year-over-year increase of 19%, exceeding the market expectation of about $90.7 billion; the non-GAAP earnings per share were $4.89, also surpassing the expected $4.73. However, the more noteworthy change in this earnings report is that Microsoft disclosed Azure's quarterly dollar revenue for the first time: $33.17 billion, a year-over-year increase of 48%, higher than the approximately $32.32 billion expected by StreetAccount. The market originally expected its growth rate to be around 44%, with the previous quarter's growth rate at 43%.
With this figure, Azure's growth is easier to measure directly. According to Microsoft's disclosed data, Azure revenue has surpassed one-third of the company's total revenue for the quarter. For investors, this not only means that the cloud business continues to accelerate but also clarifies the connection between AI infrastructure investments and actual business revenue. However, revenue growth can only answer how much business is being generated from investments and does not alone indicate how much profit and cash these revenues will ultimately yield.
Another basis for Microsoft's continued expansion is the accumulated customer orders. This quarter, commercial remaining performance obligations grew 73% to $677 billion, with an average duration of about 2.3 years, of which about 30% is expected to be recognized as revenue in the next 12 months. Management also expects that, at constant exchange rates, Azure's revenue growth rate for the second fiscal quarter will reach 49% to 50%. These data provide a relatively clear observation window for future revenue and explain why Microsoft still has the motivation to continue expanding data centers and computing power supply.
Correspondingly, capital expenditures are still rapidly increasing. Microsoft's capital expenditures for this quarter were $45.2 billion, including $7.4 billion in finance leases, below the StreetAccount expectation of $50.67 billion. The company explained that part of the difference comes from third-party cabinet deliveries being delayed until the second half of the year; management expects second-quarter capital expenditures to exceed $50 billion, with approximately $170 billion for the entire calendar year of 2026, and investments in the second half will continue to accelerate. Rising memory and storage costs may also further increase construction costs.
Therefore, it should not be interpreted that Microsoft is beginning to shrink AI investments just because the quarterly capital expenditures were below expectations. Delivery delays may affect the recognition pace of expenditures but do not necessarily change the overall construction plan. What truly needs to be observed is whether Azure's revenue and profits can keep pace as investments continue to increase.
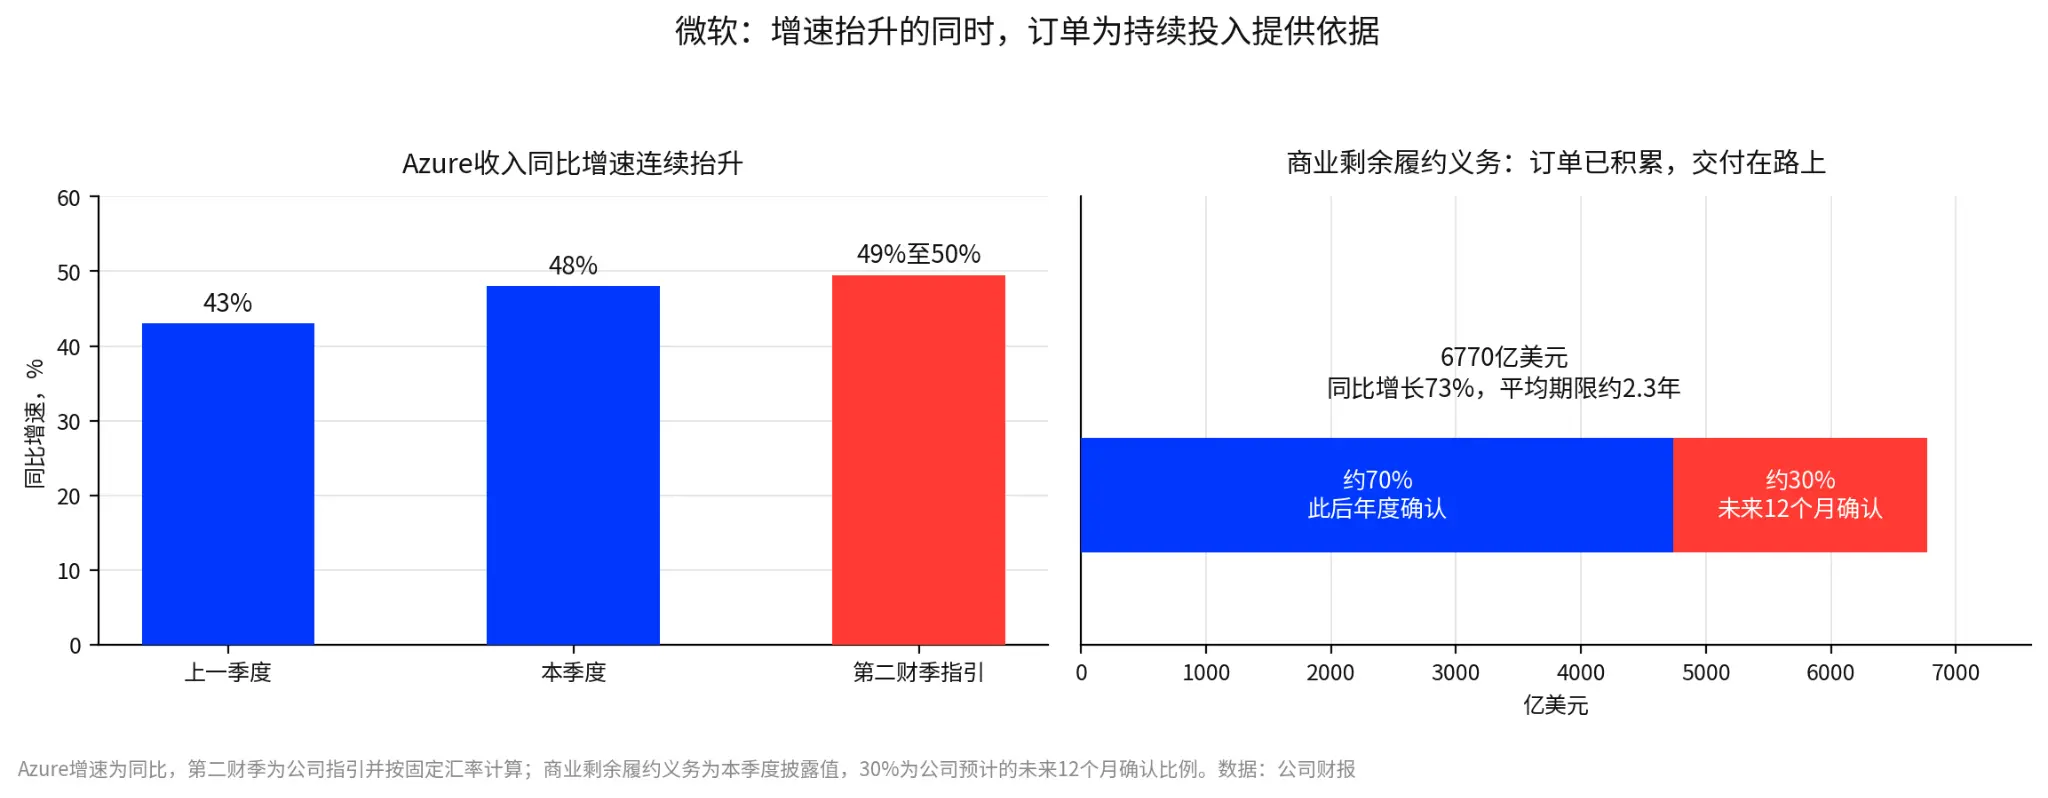
Figure 1: Year-over-year growth rate of Azure revenue and composition of commercial remaining performance obligations. Note: The growth rate for the second fiscal quarter is the company's guidance, calculated at constant exchange rates; about 30% of the commercial remaining performance obligations are the company's expected recognition ratio for the next 12 months.
Currently, some noteworthy pressures have emerged. Microsoft's cloud business gross margin for this quarter was 66%, a year-over-year decline, and management expects it to further drop to about 65% in the second fiscal quarter, partly due to the revenue structure leaning towards Azure. Free cash flow was $18.63 billion, also lower than the previous quarter's $19.64 billion. As data centers, servers, chips, and memory procurement continue to expand, even with sufficient orders, costs may outpace revenue recovery for some time.
This helps to understand why Microsoft's stock price, which briefly rose over 6% in after-hours trading, fell back to about a 2.9% increase around 7:59 PM Eastern Time on the 28th. The market recognizes Azure's growth and order scale but is also reassessing the costs required for that growth. Moving forward, the key is not just whether Azure can maintain a growth rate close to 50%, but also whether the cloud business gross margin continues to decline and whether free cash flow can remain resilient under larger capital expenditures. Orders provide a more solid basis for Microsoft's growth but cannot replace the examination of investment returns.
II. Google: Cloud business growth of 103%, why is cash flow still a concern?
If we only look at the cloud business, Google's performance in the third quarter is not weak. Alphabet's revenue was $127.58 billion, a year-over-year increase of 25%, slightly below the market expectation of $128.22 billion; search and other advertising revenue was $63 billion, a year-over-year increase of 12%, also below expectations. The company's operating profit reached $40.6 billion, a year-over-year increase of 30%, with an operating profit margin of 31.8%. Google Cloud revenue grew 103% year-over-year to $30.7 billion, with the operating profit margin rising from 23.7% in the same period last year to 36.2%, and backlog orders reached $561 billion, of which over 55% are expected to be recognized in the next 24 months.
This set of data indicates that Google's cloud business is not only growing rapidly but also improving in profitability, with a substantial future order scale. The problem is that growth at the business level has not yet translated into more ample cash flow at the group level. For companies building AI infrastructure on a large scale, revenue growth and cash recovery are not the same thing: customer demand can first manifest in orders and revenue, while expenditures on servers, data centers, and related equipment may occur earlier.
In the third quarter, Google's free cash flow was negative $9.07 billion, marking the second consecutive quarter of negative cash flow, further widening from the previous quarter's negative $5.86 billion, and significantly below the market expectation of about negative $2.7 billion. During the same period, capital expenditures rose from $44.92 billion in the second quarter to $51.36 billion. The company maintains its full-year capital expenditure guidance of $195 billion to $205 billion for 2026 and expects a significant increase in 2027.
In other words, Google continues to maintain high growth, but the gap appears between growth and cash flow. Google Cloud's revenue doubling and improving profit margins indicate that new demand is being converted into business results; however, the scale of group capital expenditures is also substantial, and free cash flow remains negative, making it difficult for investors to judge when the overall AI investment can be recouped based solely on the high growth of the cloud business.
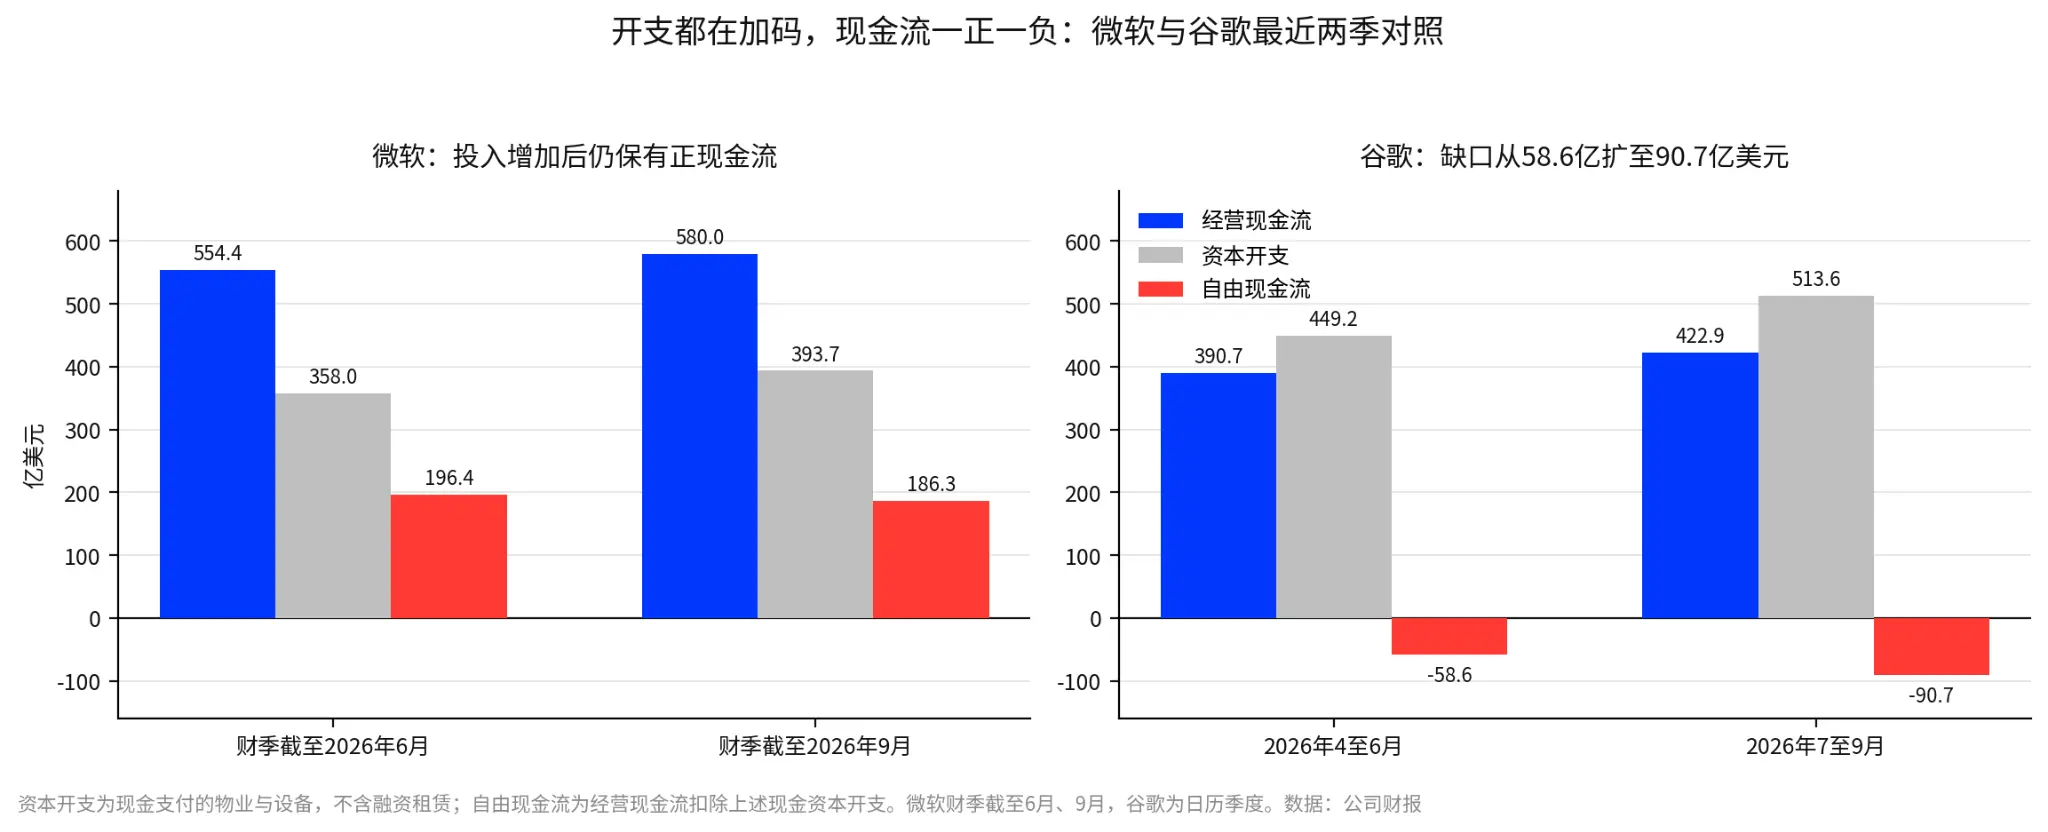
Figure 2: Comparison of operating cash flow, capital expenditures, and free cash flow for Microsoft and Google in the last two quarters, in units of $100 million. Note: The capital expenditures in the figure are cash payments for property and equipment, excluding finance leases; the $45.2 billion capital expenditure mentioned in the text includes $7.4 billion in finance leases, and the calculation standards differ.
From the perspective of cash flow comparison, the differences between the two companies become more intuitive. Based on cash capital expenditures, Microsoft's operating cash flow rose from $55.44 billion to $58.00 billion, and after deducting $39.37 billion in cash capital expenditures, free cash flow still stood at $18.63 billion, though slightly down from the previous quarter. Google's operating cash flow was $42.29 billion, below the $51.36 billion capital expenditures, resulting in a $9.07 billion shortfall in free cash flow, which further widened from the previous quarter.
This does not mean that Microsoft's AI investments are necessarily more efficient than Google's, nor can one quarter's cash flow alone determine the long-term returns of the two companies. What it reveals is that the pace of investment that both companies can currently sustain is different: Microsoft retains positive free cash flow after large-scale capital expenditures, while Google needs to use more cash to support its construction. For investors, the latter implies higher capital occupation and makes the uncertainty of return realization time harder to ignore.
Additionally, Google's cash flow pressure this quarter cannot be entirely attributed to AI capital expenditures. Management mentioned in the conference call that cash flow was also affected by increased inventory related to TPU system sales and the payment of a $5.2 billion fine to the European Commission. The increase in inventory involves a business rhythm of stocking first and collecting payments later, while the fine is a different nature of cash expenditure. Since the company has not disclosed the specific amount of inventory investment, the existing information is insufficient to accurately separate the impact of these factors. Therefore, a single quarter of negative free cash flow does not directly prove that Google's AI investment returns are poor, but the continuous widening cash gap indeed raises the difficulty for investors in judging the return cycle.
Another factor that needs to be distinguished is earnings per share. Google's earnings per share for the third quarter were $2.14, affected by other income and losses totaling negative $8.2 billion, most of which came from unrealized losses due to price changes in its stake in SpaceX. This item affects accounting profits but is not the same as the operating cash flow issue and should not be interpreted together.
In summary, Google's cloud business growth has not stalled. The core issue is when high-speed growth can lead to improvements in group-level cash flow. Microsoft has a large scale of commercial remaining performance obligations as clues for future revenue; Google also has a substantial backlog of cloud business orders, but with capital expenditures continuing to rise, it still needs to provide evidence of gradually improving cash flow. Until this path becomes clearer, even outstanding performance in the cloud business may not be enough to dispel market concerns about overall investment returns.
III. Storage: Long-term contracts lock in over half of capacity, tight supply and demand support profitability
The divergence in stock prices between Microsoft and Google mainly revolves around investment returns; the rise in the storage sector has a more direct logic: when demand grows faster than supply expansion, the party with capacity has a better chance of gaining pricing power.
SK Hynix's revenue in the third quarter reached 104.62 trillion Korean won, a year-over-year increase of 328%, with quarterly revenue surpassing 100 trillion Korean won for the first time; operating profit was 83.33 trillion Korean won, a year-over-year increase of 632%, with an operating profit margin of about 80%, both indicators hitting a quarterly record high. Net profit was 39.78 trillion Korean won, a year-over-year increase of 216%. Such strong profitability is certainly important, but what is more noteworthy is that the company's visibility into demand for the coming years is improving, with some capacity already locked in through long-term supply agreements.
According to the company's earnings briefing, SK Hynix has signed long-term supply agreements with 14 core customers, including leading global cloud providers, typically for five years, with the contracted supply exceeding 50% of the total capacity for 2027 and 2028. The company also stated that if the signed long-term agreements are combined with the demand currently being negotiated with customers, the capacity for DRAM and HBM is close to being sold out by 2029; customer order demand exceeds actual supply capacity by more than twice. Considering the complexity of advanced processes and the time required for new capacity construction, the company expects the supply-demand imbalance to continue until 2030.
There is an important distinction here: signed long-term supply agreements and customer demands still under negotiation are not the same thing. The former provides relatively clear supply arrangements, while the latter reflects potential demand intensity, which may still be adjusted according to changes in customer plans. Therefore, near-sold-out capacity does not equate to all capacity being locked in by contracts until 2029. Nevertheless, the current coverage rate of long-term agreements and the scale of customer demand indicate that storage supply is not easily able to keep pace with demand in the short term.
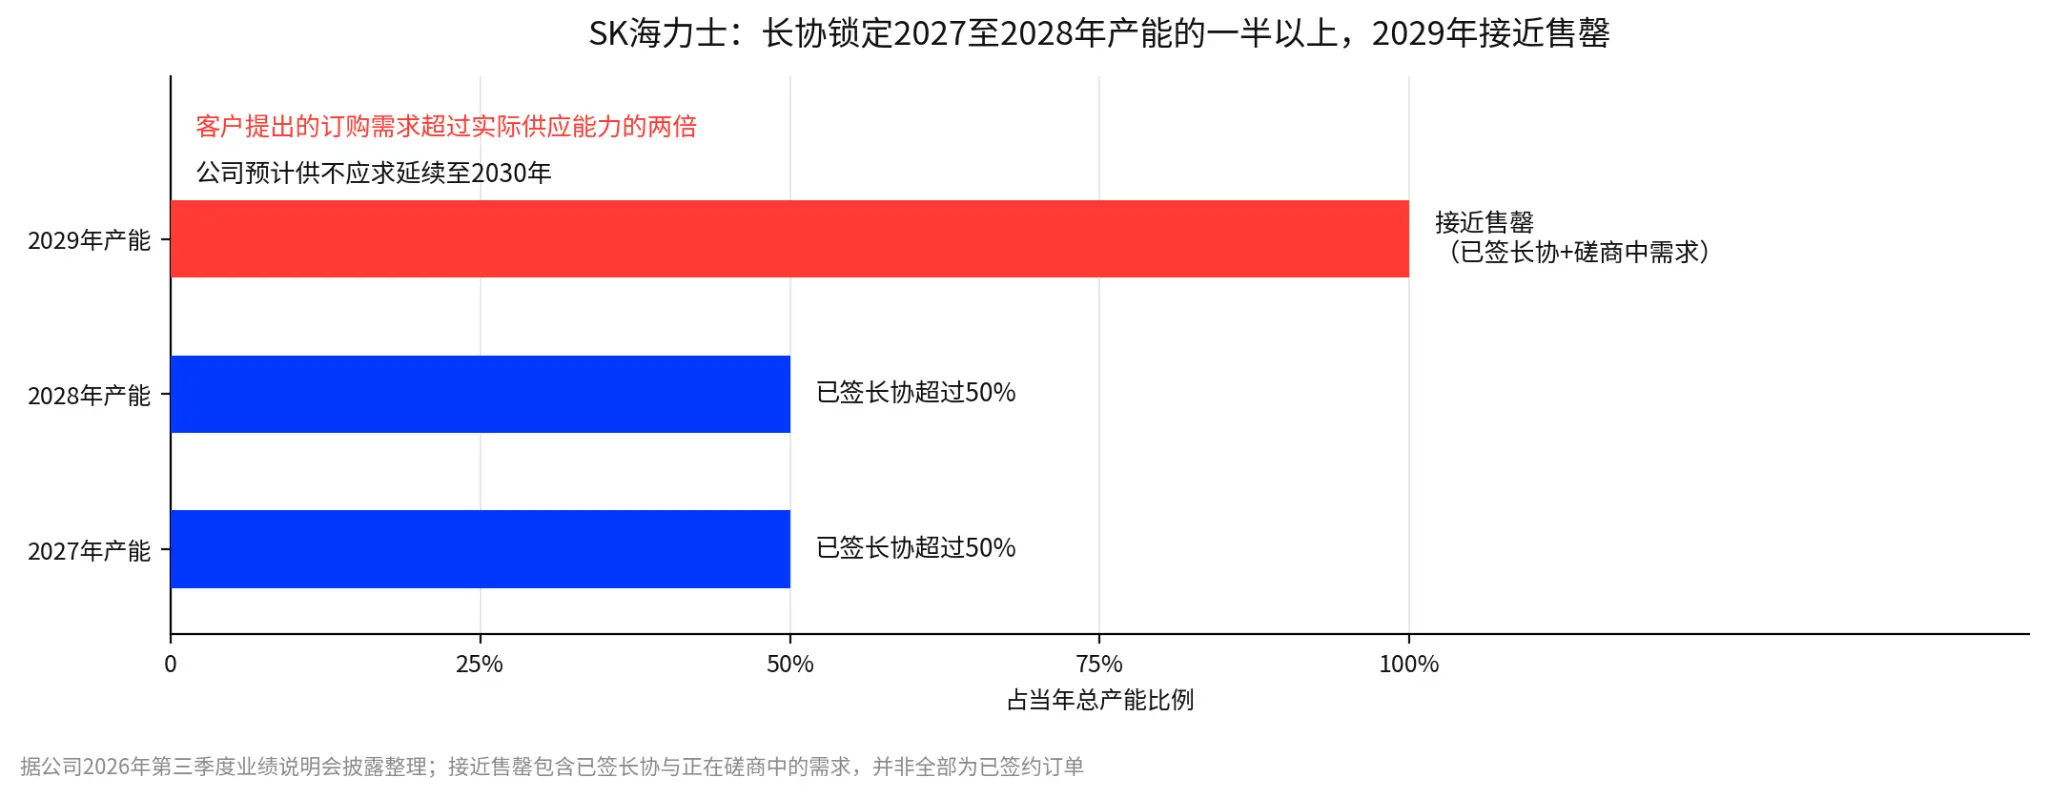
Figure 3: Coverage of SK Hynix's long-term supply agreements for capacity from 2027 to 2029. Note: Compiled from the company's performance briefing; the judgment of near-sold-out capacity in 2029 includes both signed long-term agreements and demands under negotiation, not all of which are signed orders.
This is also an important reason why the storage sector can strengthen against the backdrop of cash flow pressure on cloud vendors. Microsoft and Google need to continuously prove that new capital expenditures can bring sufficient revenue and cash returns, while storage vendors can directly benefit from product prices, product structure, and capacity utilization when supply is constrained. SK Hynix also plans to return approximately 100 trillion Korean won to shareholders through dividends and buybacks, which is about 75 billion dollars according to MarketWatch. High profitability and shareholder return arrangements also provide additional grounds for the market to assess its earnings and capital returns.
In terms of market performance, SK Hynix rose 10.89% in the Korean market on October 28, with an intraday increase of over 11%; SK Hynix-related securities listed in the U.S. rose over 13% at one point. Micron, Seagate, and Western Digital rose by 5.86%, 4.51%, and 4.08%, respectively, while the Philadelphia Semiconductor Index rose by 1.76%. These increases cannot all be attributed to SK Hynix's performance information, but the overall trend reflects that investors are reassessing the profit potential of the storage industry chain in the expansion of AI infrastructure.
Of course, long-term agreements lock in supply relationships, but this does not mean that all products can be sold at current prices in the future, nor does it guarantee that profit margins will remain high in the long term. If major cloud vendors significantly cut investments in 2027, the demand expectations for AI servers and data centers may still be impacted, and capacity outside of long-term contracts is particularly susceptible to repricing. The specific pricing mechanisms, adjustment ranges, and performance guarantee clauses of long-term agreements will also affect how much profit vendors can retain when supply and demand weaken.
Therefore, storage is also affected by cloud vendors' capital expenditures, but with an additional layer of supply constraints that are not easily dissipated in the short term. As long as demand remains stronger than supply, vendors have the opportunity to continue benefiting from prices and capacity utilization without having to rely entirely on the assumption that cloud vendors' capital expenditures will always accelerate. At this stage, the supply-demand gap, product structure, and long-term contracts remain the most direct profit supports for the storage sector.
IV. Robot DRAM Demand Grows Over 20 Times in Five Years: Future Increment, Not the Current Main Line
The growth story of storage demand may extend beyond data centers. On October 27, Musk discussed the demand for memory from robots on social media, believing that as AI enters the physical world, the demand for memory from robots may far exceed current market expectations. He also pointed out that the memory used by robots is not the same as the high-bandwidth memory (HBM) required by data centers; low-power DRAM, or LPDDR, will also become an important component.
A report released by Counterpoint Research on October 11 predicts that the demand for humanoid robot DRAM will grow from approximately 8,300 terabits in 2026 to about 172,000 terabits in 2030, an increase of over 20 times; the average DRAM load per robot is expected to double to 39GB. Musk later criticized this prediction as overly conservative, believing that actual demand could be greater. Micron CEO Mehrotra previously stated that physical AI could become an important driver of memory and storage demand by the end of this decade.
From an industrial logic perspective, robots could indeed provide a new source of demand for the storage market. Capital expenditures by cloud vendors will be influenced by financing costs, cash flow, and the commercialization progress of AI services; robot memory demand will depend more on product implementation, sales growth, and individual hardware configurations. The two demand curves do not completely synchronize, so robots may become another growth driver for the storage industry in the future.
However, a high growth rate does not mean that the market size is already large enough. The 20-fold growth predicted by Counterpoint starts from a relatively small base; to assess its impact on the overall DRAM market, it is necessary to consider total demand size, actual robot sales, and individual memory configurations. The transition from predicted robot demand to actual procurement will also take time.
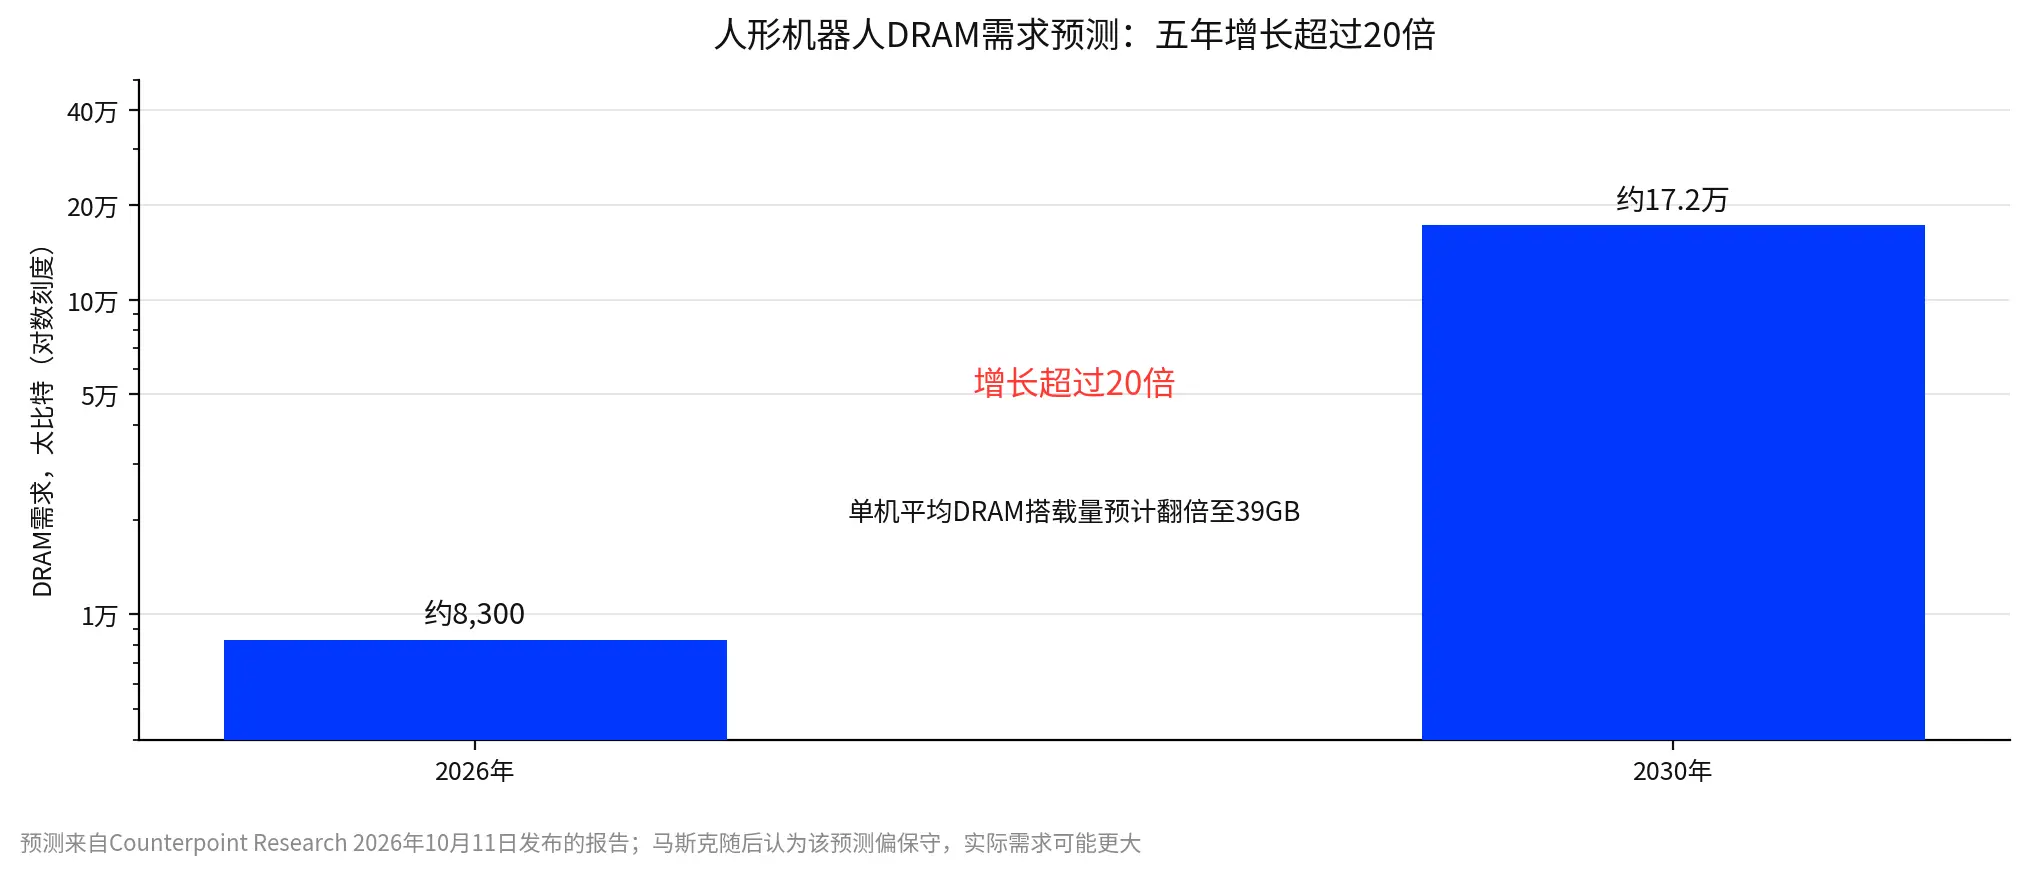
Figure 4: Forecast of humanoid robot DRAM demand from 2026 to 2030. Note: The forecast comes from the report released by Counterpoint Research on October 11, 2026; Musk later considered this forecast to be conservative.
Therefore, at this stage, it is more appropriate to view robot memory as a long-term increment for the storage industry, which is currently insufficient to explain the rise in storage stocks. Current profits are still mainly supported by supply-demand tension, product structure, and long-term supply agreements. Robots provide a direction worth tracking: if future sales and individual memory configurations gradually fulfill predictions, the growth foundation for storage demand has the opportunity to expand further.
V. Oracle: From Negative 23.7 Billion Dollars in Free Cash Flow to Positive 30 Billion Dollars in Fiscal Year 2029
Oracle has provided another answer worth market attention: it did not release a new quarterly financial report but chose to lay out the peak of investments, financing needs, and the timeline for turning cash flow positive over the next few years.
At the investor day on October 28, Oracle projected that capital expenditures would peak in the fiscal years 2027 to 2028 and decline in fiscal year 2029; free cash flow is expected to turn positive in the second half of fiscal year 2028, reaching at least 30 billion dollars in fiscal year 2029. Oracle's fiscal year ends in May each year. The company also stated that the additional financing scale before fiscal year 2030 would not exceed 20 billion dollars, with equity financing and debt financing each accounting for 10 billion dollars; starting from fiscal year 2029, business growth will gradually achieve self-funding, with the net debt to adjusted EBITDA ratio falling below 3.5 times. Meanwhile, the company set a target of over 225 billion dollars in revenue for fiscal year 2030.
The significance of these numbers goes beyond how large the revenue target is. Oracle is attempting to answer a set of questions that the market is most concerned about: when will capital expenditures peak, when will cash flow turn positive, how much additional financing is needed before turning positive, and when can growth rely more on cash generated from the business itself.
This roadmap awaits realization, and the related numbers have not yet become achieved performance. Oracle's free cash flow for the last fiscal year was negative 23.7 billion dollars, and to reach at least positive 30 billion dollars in fiscal year 2029, it still needs to go through several stages, including capital expenditures peaking, data center expansion, customer business converting into revenue, and gradual improvement of operating cash flow. Any one of these stages falling short of expectations could delay the timeline for turning cash flow positive.
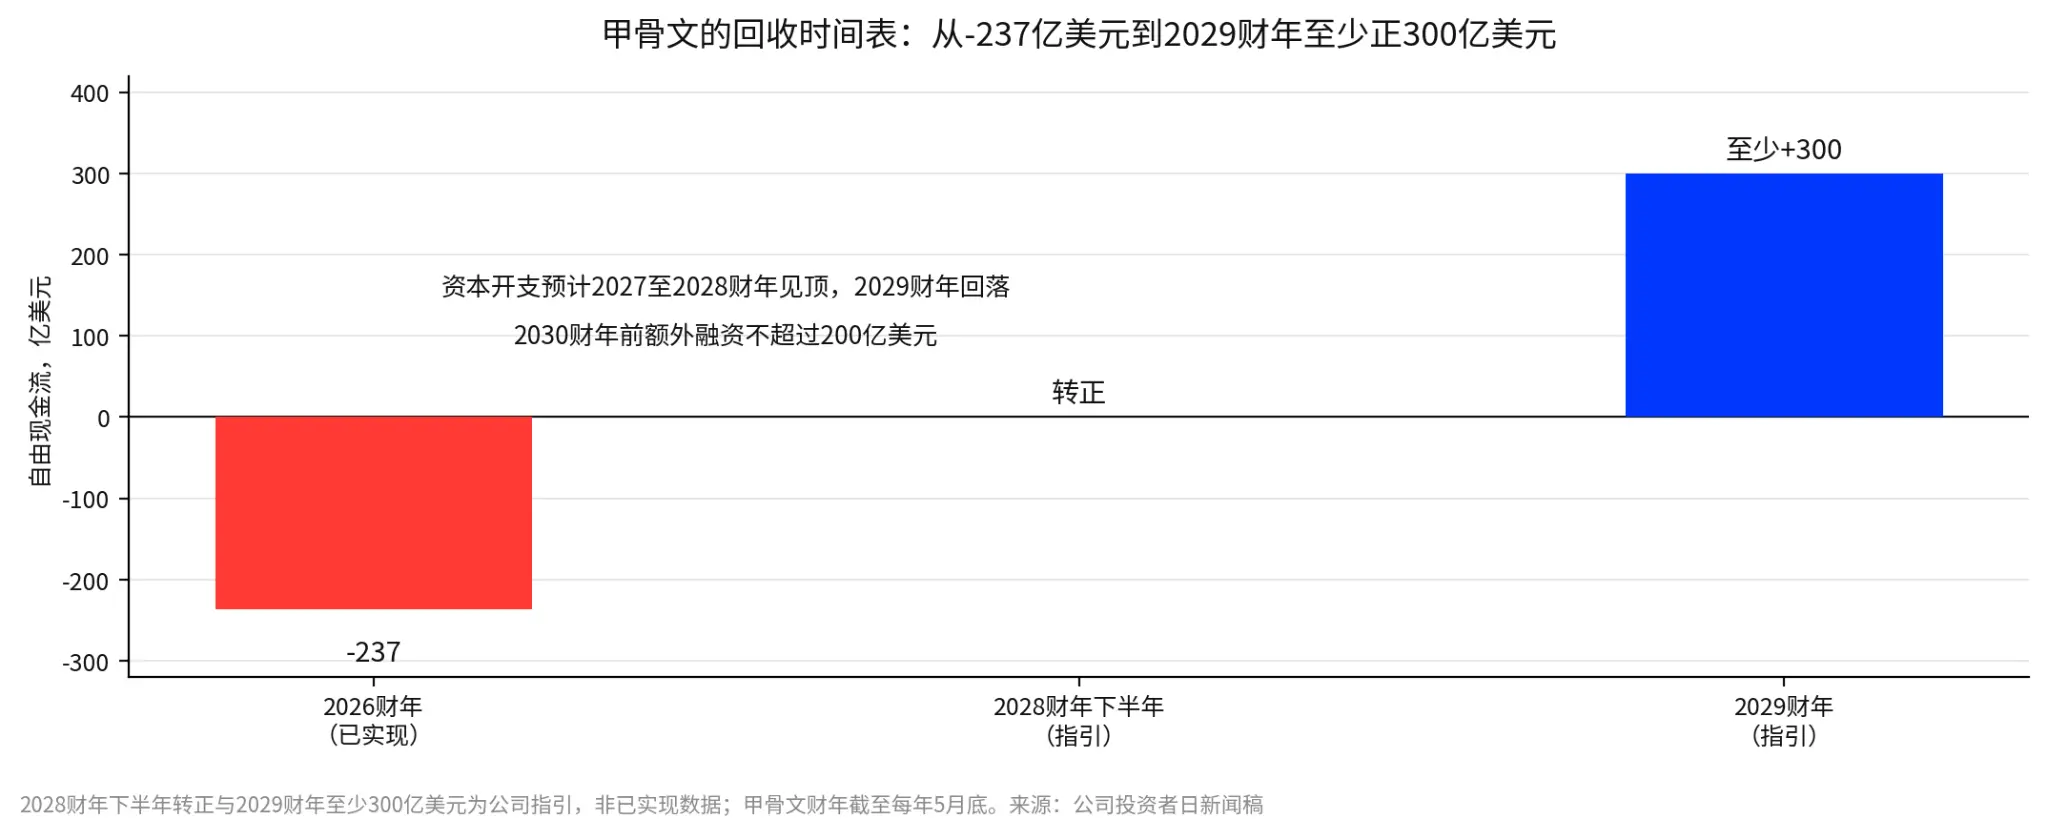
Figure 5: Oracle's free cash flow recovery timeline. Note: Compiled from the company's investor day materials; the positive free cash flow in the second half of fiscal year 2028 and the target of at least 30 billion dollars in fiscal year 2029 are management guidance, not realized data.
Nevertheless, a clear timeline still helps investors assess risks. Compared to narratives that only emphasize future demand without clearly explaining the cash flow recovery path, Oracle's phased targets are easier to validate continuously: whether capital expenditures peak as scheduled, whether free cash flow turns positive in the second half of fiscal year 2028, whether additional financing is controlled within 20 billion dollars, and whether it can achieve at least 30 billion dollars in free cash flow in fiscal year 2029.
Oracle's stock rose 10.58% on that day, with an intraday increase of over 13%, which can be understood as the market responding positively to this plan. However, an increase in stock price does not equate to the target being validated. What truly matters going forward is whether the company can advance construction as planned while allowing new business to gradually cover initial investments.
When comparing Microsoft, Google, and Oracle, there is no distinction between good and bad companies; the difference lies in the evidence of returns that the market can currently see. Microsoft has faster revenue growth and order accumulation, but profit margins and cash flow still need observation; Google's cloud business performs strongly but needs to prove when the group's cash flow will improve; Oracle provides a mid-term recovery roadmap, which must now be realized through actual operating results.
Conclusion: The AI Market Has Not Ended; The Market Is Just Starting to Demand Returns for Investments
The market differentiation on October 28 can be understood along three lines: revenue and orders, cash flow realization timeline, and supply-demand and capacity.
Microsoft Azure's growth rate reached 48%, and commercial remaining performance obligations increased to 677 billion dollars, indicating that the market is still willing to pay a premium for AI investments supported by demand. However, orders do not equate to profits; changes in Microsoft's cloud business gross margin and free cash flow will still affect the market's valuation of this growth.
Google's cloud business grew by 103%, yet it failed to prevent the group's free cash flow from turning further negative, indicating that there is still a significant time lag between business growth and cash recovery. Oracle, on the other hand, attempts to provide clearer arrangements for this waiting period through capital expenditures peaking, limited financing scale, and cash flow positive targets. For investors, growth stories are not scarce; the key is whether the path to cash flow improvement can be continuously validated.
Storage vendors benefit from strong demand, constrained supply expansion, and the visibility of orders brought by long-term contracts. They will also be affected by changes in cloud vendors' capital expenditures, but the short-term supply-demand gap provides additional support for profits. Robot memory demand may expand future market space, but it still requires sales and actual procurement to prove its scale.
Thus, a judgment that needs continuous validation can be proposed: the market is still pricing AI investments, but it has raised the requirements for the return path. This judgment may also change with subsequent data. If Google can significantly improve cash flow while continuing to increase capital expenditures, market concerns about it may ease; if Microsoft's cloud business gross margin continues to decline, order growth may not be sufficient to offset margin pressure; if cloud vendors significantly slow down investments in 2027, demand and prices outside of long-term contracts may also come under pressure. Whether Oracle's cash flow targets can be realized will also need subsequent financial reports to gradually provide answers.
Moving forward, indicators worth continuous tracking include changes in storage prices and long-term contracts, Microsoft and Google's capital expenditures and cash flow for the next quarter, Oracle's progress in turning cash flow positive in the second half of fiscal year 2028, and whether robot memory demand can transition from industry forecasts to actual orders.
In the next phase of AI trading, the focus of comparison may shift from who invests more and who grows faster to who can more quickly convert investments into sustainable revenue, profits, and cash flow. For investors, this also means that valuation differentiation may not disappear with the growth of AI demand; rather, it may become more pronounced as capital expenditures continue to expand.
Data Source
Microsoft Q1 FY2027, Alphabet Q3 FY2026 performance and conference call: Company financial reports and minutes, October 28, 2026; market expectations come from StreetAccount summaries and media reports.
SK Hynix Third Quarter Performance and Long-Term Supply Agreement: Company performance briefing and compiled by Caixin, Shanghai Nonferrous Metals Network, MarketWatch, October 28, 2026; approximately 1 quadrillion Korean won in shareholder returns is about 75 billion US dollars according to MarketWatch.
Oracle Investor Day Goals: Company press release, October 28, 2026; fiscal year ends at the end of May each year, both the turnaround and the 2029 fiscal year goals are company guidance, not realized data.
Market Data: Closing and after-hours on October 28, 2026; an increase of about 2.9% is the after-hours quote as of 7:59 PM Eastern Time on the 28th.
Robot Demand Forecast: Counterpoint Research report, October 11, 2026; Musk's statements are reported by Caixin and IT Home, October 27 to 28, 2026.
Disclaimer: The content of this article is for general information and market commentary only, compiled based on publicly available information as of the time mentioned in the text, and relevant market data, expectations, and probabilities may change with market conditions. The views and investment strategies cited from third-party institutions, analysts, or other individuals in this article only represent the views of the relevant third parties at a specific time and do not represent the views or recommendations of BIT. This article does not constitute investment advice, investment research, an invitation, solicitation, or recommendation for any securities, investment products, or trading strategies, nor should it be the basis for any investment decision. Financial markets carry risks, and securities prices and market performance may fluctuate; past performance and historical market trends do not represent or guarantee future results. Investors should independently assess relevant risks based on their own circumstances and seek professional advice when necessary.
 Risk warning Risk warning




Popular articles