Similarly, profits surged, HSBC fell, and Hansoh Pharmaceutical rose: What is the Hong Kong stock market rewarding during earnings season?

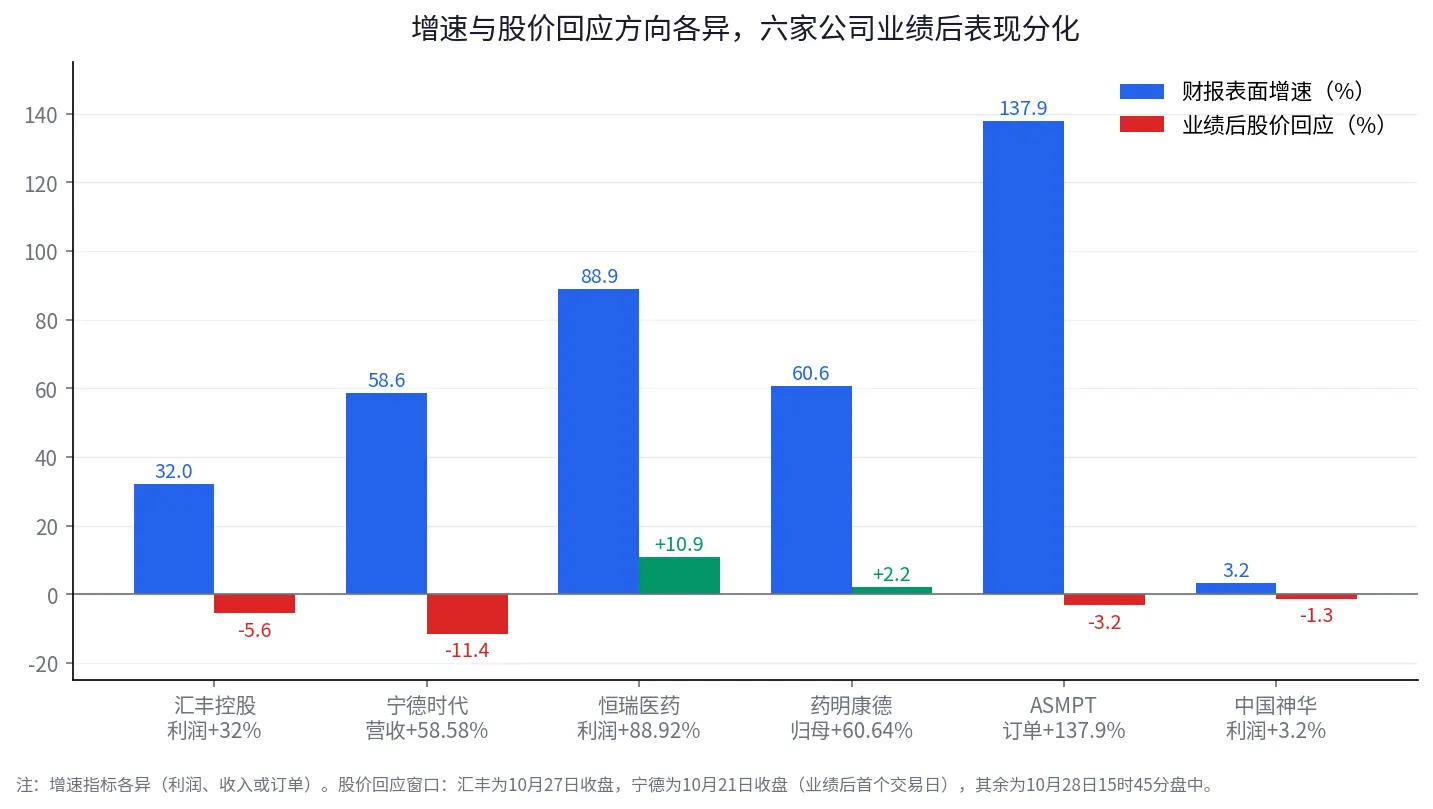
The financial reports of six companies show varying growth rates and stock price responses, with different growth indicators. The response window is explained in the image.
1. The sharper the index drop, the more financial reports must answer one question: How much is growth worth?
From October 20 to 23, the Hang Seng Index fell a cumulative 4.52%, and the Hang Seng Tech Index fell 5.76%. On October 22, the Hang Seng Index dropped 3.03% in a single day, while the Hang Seng Tech Index fell 5.03%. During the same period, net outflows from southbound funds amounted to approximately HKD 17.046 billion, with net selling on all four trading days. The larger pullback in tech stocks indicates that this round of pressure is not evenly borne by all assets, as high-volatility growth stocks amplify fluctuations when risk appetite changes. 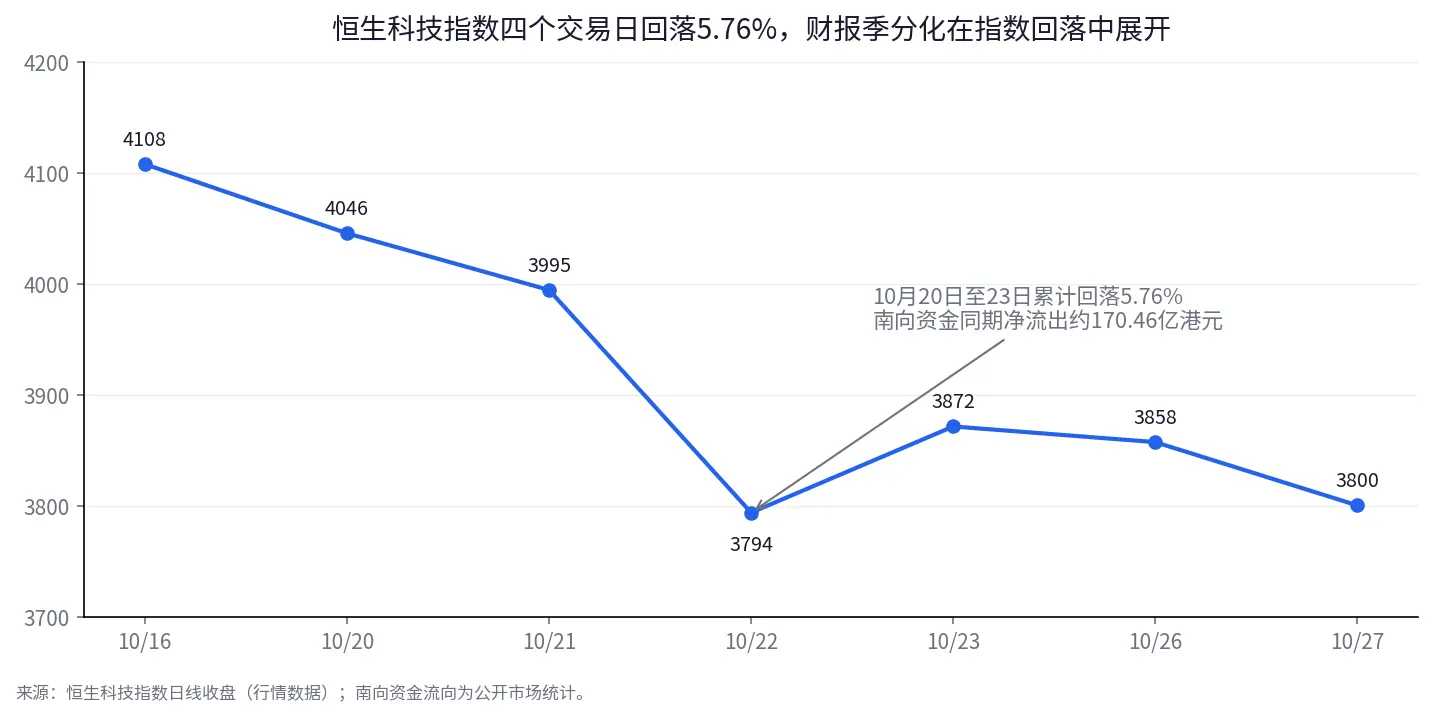
The closing trend of the Hang Seng Tech Index shows a cumulative drop of 5.76% from October 20 to 23, while net outflows from southbound funds were approximately HKD 17.046 billion during the same period.
There are at least three forces at play. First, the global adjustment of tech stocks has reignited discussions about the return cycle of AI capital expenditures. In the past, the market was willing to pay high valuations for computing power, semiconductors, and AI infrastructure because investors believed that today's investments would translate into future revenues and profits. When the scale of investment continues to expand and the commercialization returns still need time to validate, valuations must be recalculated. AI demand has not disappeared; what has changed is the timing of revenue realization, profit margins, and the weight of capital returns in pricing.
Second, there is a gap between policy expectations and actual data. When the market has already priced in the possibility of increased stimulus policies, even if economic data does not deteriorate, it may not be enough to drive valuations higher. Stock prices reflect changes in actual results relative to existing market expectations; isolated economic data alone does not provide answers. Third, the shift to net outflows from southbound funds increases the adjustment pressure on sectors that had previously seen significant gains and concentrated positions.
However, index pressure does not equate to a unified bearish outlook on growth. What truly deserves attention is which companies' growth remains convincing to investors when overall valuations are under pressure. The pressure on the index comes from valuations, policy expectations, and capital, while the real clue during earnings season is the differentiation among individual stocks. HSBC and Contemporary Amperex Technology reveal discounts behind impressive numbers, while Hansoh Pharmaceutical, WuXi AppTec, and ASMPT showcase different types of growth evidence. China Shenhua further illustrates that what the market is willing to buy may not be high growth rates but rather more certain cash returns.
2. HSBC's profit growth of 32% still falls 5.56%: The market is unwilling to pay the same price for a one-time improvement
HSBC's third-quarter financial report does not look bad. The company reported a pre-tax profit of USD 9.632 billion, a year-on-year increase of 32%. After-tax profit grew 38% to USD 7.6 billion, with net interest income reaching USD 9.3 billion, a year-on-year increase of 6%. The company also announced a third interim dividend of USD 0.1 per share and plans to initiate a share buyback of up to USD 1 billion. However, on the trading day following the earnings announcement, HSBC's stock price closed down 5.56%, at HKD 134.30.
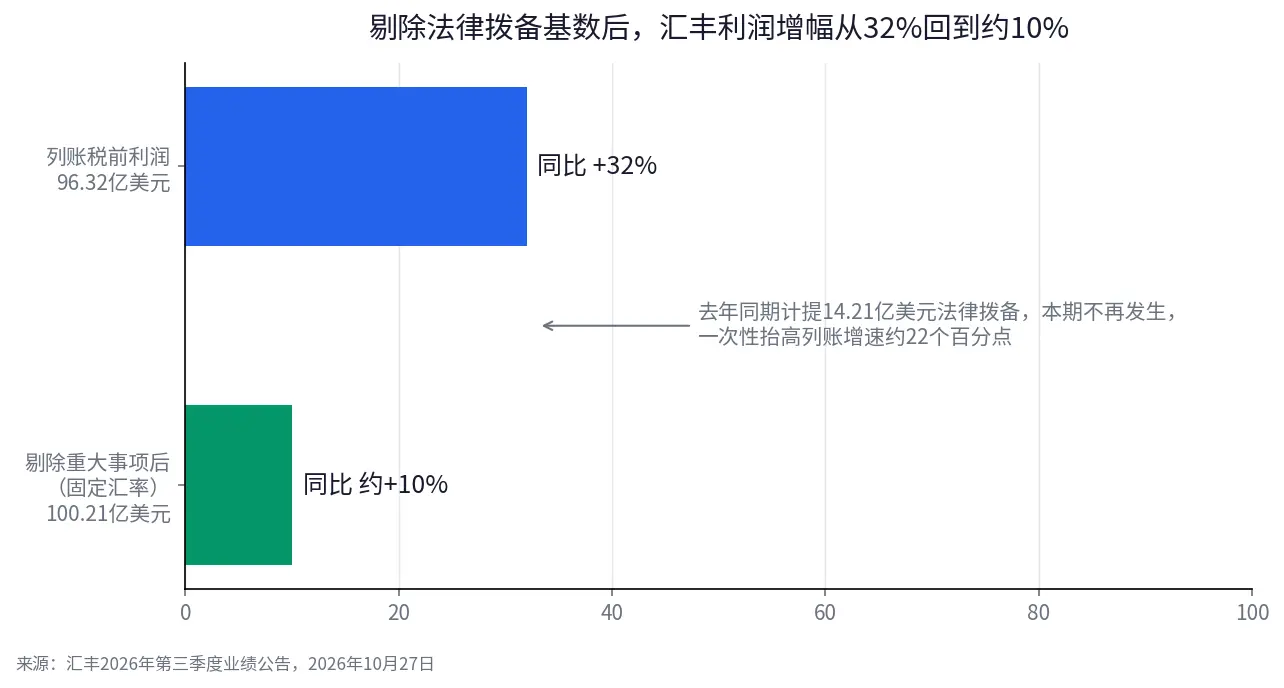
Excluding the USD 1.421 billion legal provision base, HSBC's profit growth rate drops from 32% to about 10%.
To understand this contrast, we must first break down the 32% profit growth. In the same period of 2025, HSBC made a provision of approximately USD 1.421 billion related to a claim against the Madoff fraud case in Luxembourg, which did not incur similar expenses this period, thus creating a significant year-on-year base advantage. Excluding extraordinary items and calculating at fixed exchange rates, HSBC's pre-tax profit for the third quarter is approximately USD 10.021 billion, with a year-on-year growth rate of about 10%, which is considerably lower than the reported figure of 32%. Meanwhile, the company's revenue was USD 18.62 billion, a year-on-year increase of 4.7%, below the market expectation of USD 18.93 billion, and wealth management revenue was approximately USD 2.7 billion, roughly flat year-on-year, with growth not continuing the strong momentum of the previous two quarters.
This does not mean that HSBC's operations have suddenly deteriorated. The net interest margin remains at 1.57%, with an annualized tangible equity return of 17.7%, and dividends and buybacks also support shareholder returns. The issue is that when investors look at a financial report, they do not only consider whether profits have grown, but also assess the components of that growth—how much comes from operational improvements, how much from last year's low base, and how much can be repeated in future quarters.
HSBC's stock price reaction reflects these distinctions. One-time provisions that will not recur can inflate current profits but will not generate equivalent returns every year. When revenue growth falls short of expectations, the market may downgrade its future profit assessments. Profit growth is a result that has already occurred; sustainable profitability is what valuations are truly buying. The market originally expected the company to further raise guidance; even if the reported growth rate looks impressive, it may not be enough to support the stock price.
3. Contemporary Amperex Technology's revenue grows 58.58%, but why is the stock price still under pressure? The issue lies between three tables
If HSBC's issue lies in how much one-time factors are included in profit growth, then Contemporary Amperex Technology faces another type of divergence that is more worth tracking: revenue, profit, and cash flow have not synchronized in growth.
Contemporary Amperex Technology reported third-quarter operating revenue of CNY 165.221 billion, a year-on-year increase of 58.58% and a quarter-on-quarter increase of 11.8%. The net profit attributable to the parent company was CNY 21.246 billion, a year-on-year increase of 14.54%, down 5.77% quarter-on-quarter from the second quarter, which was below the expectations of Bernstein, Goldman Sachs, and other institutions. For the first three quarters, the company's revenue reached CNY 442.137 billion, a year-on-year increase of 56.19%, and the net profit attributable to the parent company was CNY 64.530 billion, a year-on-year increase of 31.60%. The trend of rapid revenue growth has not changed, but the profit growth in the third quarter significantly lagged behind revenue growth.
Cash flow data makes this difference even more pronounced. For the first three quarters, Contemporary Amperex Technology's net cash flow from operating activities was CNY 61.625 billion, a year-on-year decline of 23.60%. According to the semi-annual and third-quarter reports, the net cash flow from operating activities for the third quarter alone was approximately CNY 1.409 billion, a year-on-year decline of 93.59%, the lowest quarterly level since the second quarter of 2018, and significantly lower than the net profit for the quarter. The company's management explained that the cash flow changes are related to adjustments in supplier payment policies, prepayments, and other factors, while current profits are affected by changes in product structure and tax policy adjustments, and they expect market demand to continue to grow until 2027. The company subsequently disclosed a share buyback plan of approximately CNY 800 million, but the buyback itself cannot replace the observation of operational data. 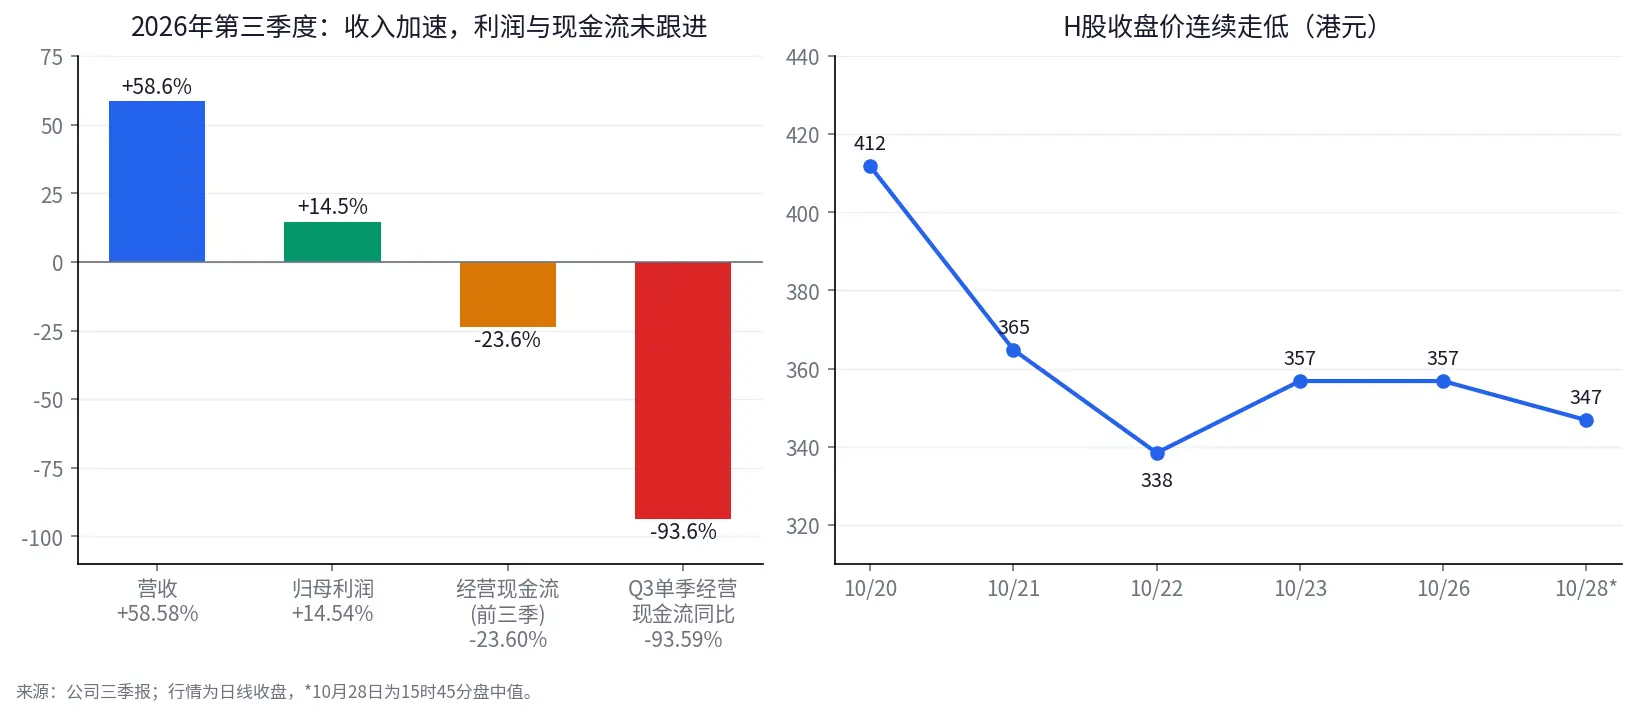
A comparison of Contemporary Amperex Technology's revenue, profit, and operating cash flow growth rates, with the right image showing the closing price trend of H-shares.
The stock price performance reflects the market's caution regarding these differences. On October 20, Contemporary Amperex Technology's H-shares closed down 6.58%. On October 21, it fell 11.41%, and on October 22, it dropped 7.24%. As of October 28, 3:45 PM, the stock price was HKD 346.8, down about 0.5% from the previous trading day's closing price.
One cannot simply conclude that "cash flow decline means deteriorating growth quality." Operating cash flow can be affected by payment cycles, prepayments, and changes in working capital, and quarterly data may also exhibit significant fluctuations. The real questions that need to be answered are threefold: whether revenue growth comes from sales expansion or changes in product and price structure, whether profit growth lagging behind revenue is due to a temporary product mix or competitive and cost pressures, and whether cash flow decline is a temporary disturbance caused by settlement timing or a more sustained change in profit conversion capability.
These three lines will determine how subsequent financial reports should be viewed. If revenue continues to grow, profit margins stabilize gradually, and operating cash flow rebounds subsequently, the divergence this quarter may stem more from temporary factors. If revenue continues to expand while profit and cash flow lag significantly over the long term, a reassessment of the economic value of growth is necessary. For Contemporary Amperex Technology, the most important task in the next phase is to prove that demand growth can be converted into profit and ultimately into cash flow.
4. Hansoh Pharmaceutical rises over 12%: High profit growth is good news, but cannot be directly extrapolated
Compared to HSBC and Contemporary Amperex Technology, Hansoh Pharmaceutical's financial report received a more positive market response. The company disclosed on the evening of October 27 that its third-quarter operating revenue was CNY 8.953 billion, a year-on-year increase of 20.55%, and the net profit attributable to the parent company was CNY 2.458 billion, a year-on-year increase of 88.92%, with the net profit attributable to the parent company after deducting non-recurring items at CNY 2.514 billion, a year-on-year increase of 90.93%. The net cash flow from operating activities for the third quarter was CNY 5.857 billion, a year-on-year increase of 21.76%. On October 28, Hansoh's H-shares rose more than 12% at one point, and by 3:45 PM, it was up about 10.9%, at HKD 49.58. 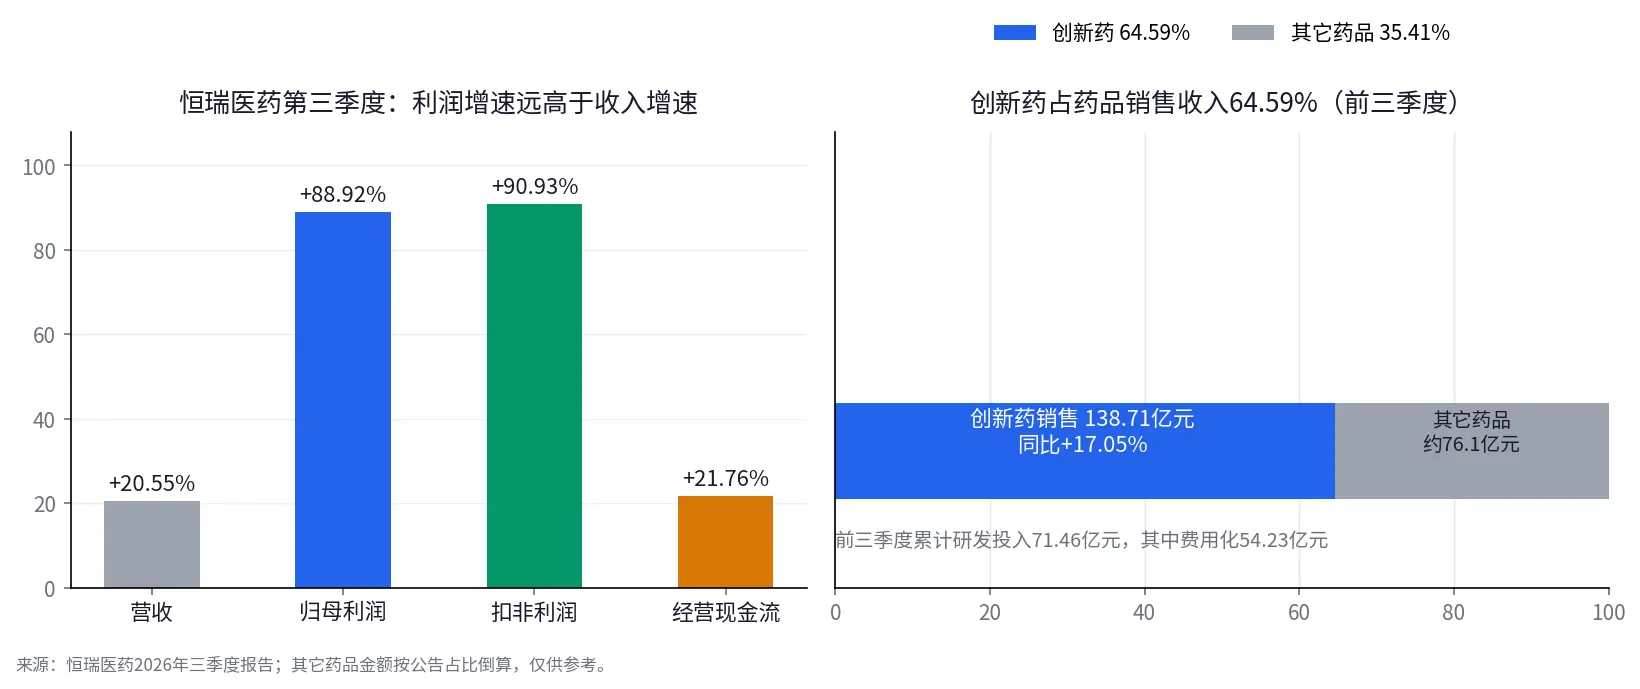
The growth rates of four core indicators for Hansoh Pharmaceutical in the third quarter, with the right image showing that sales of innovative drugs accounted for 64.59% of total drug sales in the first three quarters, with other drug amounts calculated based on the announcement's proportion.
However, to understand this rise, one cannot only look at the 88.92% net profit growth rate. Hansoh's announcement indicates that increased income from external licensing is one of the important reasons for the high profit growth this quarter. For innovative drug companies, revenue sources are not limited to drug sales; upfront payments and milestone payments from overseas licensing collaborations can also contribute to revenue and profit. These collaborations can reflect the research and development value and potential commercialization space of products, but the timing of revenue recognition is not uniform, and the profit growth rate for a particular quarter cannot be directly extrapolated as the growth rate for every future quarter.
On the other hand, Hansoh does not completely rely on one-time licensing income. For the first three quarters, the company's innovative drug sales revenue was CNY 13.871 billion, a year-on-year increase of 17.05%, accounting for 64.59% of total drug sales, with cumulative R&D investment of CNY 7.146 billion. The growth rate of net profit after deducting non-recurring items is close to that of net profit attributable to the parent company, indicating that profit improvement is not entirely driven by non-recurring gains and losses.
Therefore, what truly deserves attention in Hansoh's financial report is whether the three paths of innovative drug sales, R&D achievements, and external licensing can form a mutually supportive profit structure. Drug sales provide continuous operating income, R&D investment determines future product reserves, and overseas licensing may accelerate the commercialization of innovative results. The improvement of all three together is more meaningful in the long term than a sudden leap in quarterly profit growth.
Licensing income has another side; it can significantly inflate current profits but may cause quarterly fluctuations due to transaction and recognition rhythms. If profit growth declines subsequently, it cannot be immediately concluded that operations have deteriorated, nor can the current high growth be simply regarded as the norm; further differentiation of changes in the base of licensing income, sustained growth in innovative drug sales, and whether R&D achievements can continuously convert into new collaborations and commercial returns is needed.
Hansoh's rise indicates that the market is willing to pay for the growth of innovative drug companies, provided that investors can understand the sources of growth and believe in its sustainability. What truly determines pricing is whether different sources of income can collectively form a sustainable profit model.
5. WuXi AppTec and ASMPT: Orders provide the next stop for growth, but not a guarantee of realization
Hengrui has demonstrated that revenue and profit can be driven by multiple sources, while WuXi AppTec and ASMPT provide another perspective. Compared to quarterly profits, orders and performance guidance can help investors assess whether future business activities are still expanding. However, orders also have their limitations; taking orders does not equate to delivery, delivery does not guarantee high profits, and record orders do not necessarily mean future revenue will grow at the same rate.
WuXi AppTec's revenue for the first three quarters reached 45.537 billion yuan, a year-on-year increase of 38.59%. The net profit attributable to the parent company was 19.398 billion yuan, a year-on-year increase of 60.64%, with a 73.03% increase in net profit after deducting non-recurring items. In the third quarter, the net profit attributable to the parent company was 8.318 billion yuan, a year-on-year increase of 136.67%, which included approximately 3.102 billion yuan in one-time gains from the sale of part of its stake in the joint venture WuXi XDC. The growth rate of net profit after deducting non-recurring items for the quarter was 49.85%, which is more suitable for observing the performance of the main business.
More noteworthy than quarterly profits is the company's backlog of orders amounting to 76.74 billion yuan as of the end of September, a year-on-year increase of 36.4%, with a net increase of approximately 10.3 billion yuan in the quarter. The company also raised its full-year revenue guidance from 58.5 billion to 60.5 billion yuan to 61 billion to 61.9 billion yuan, and adjusted its expected free cash flow to 14.5 billion to 15.5 billion yuan. The growth in orders, the upward revision of revenue guidance, and the improvement in cash flow expectations form a set of mutually reinforcing signals, indicating that business demand is reflected not only in confirmed revenue but also in the workload yet to be delivered. 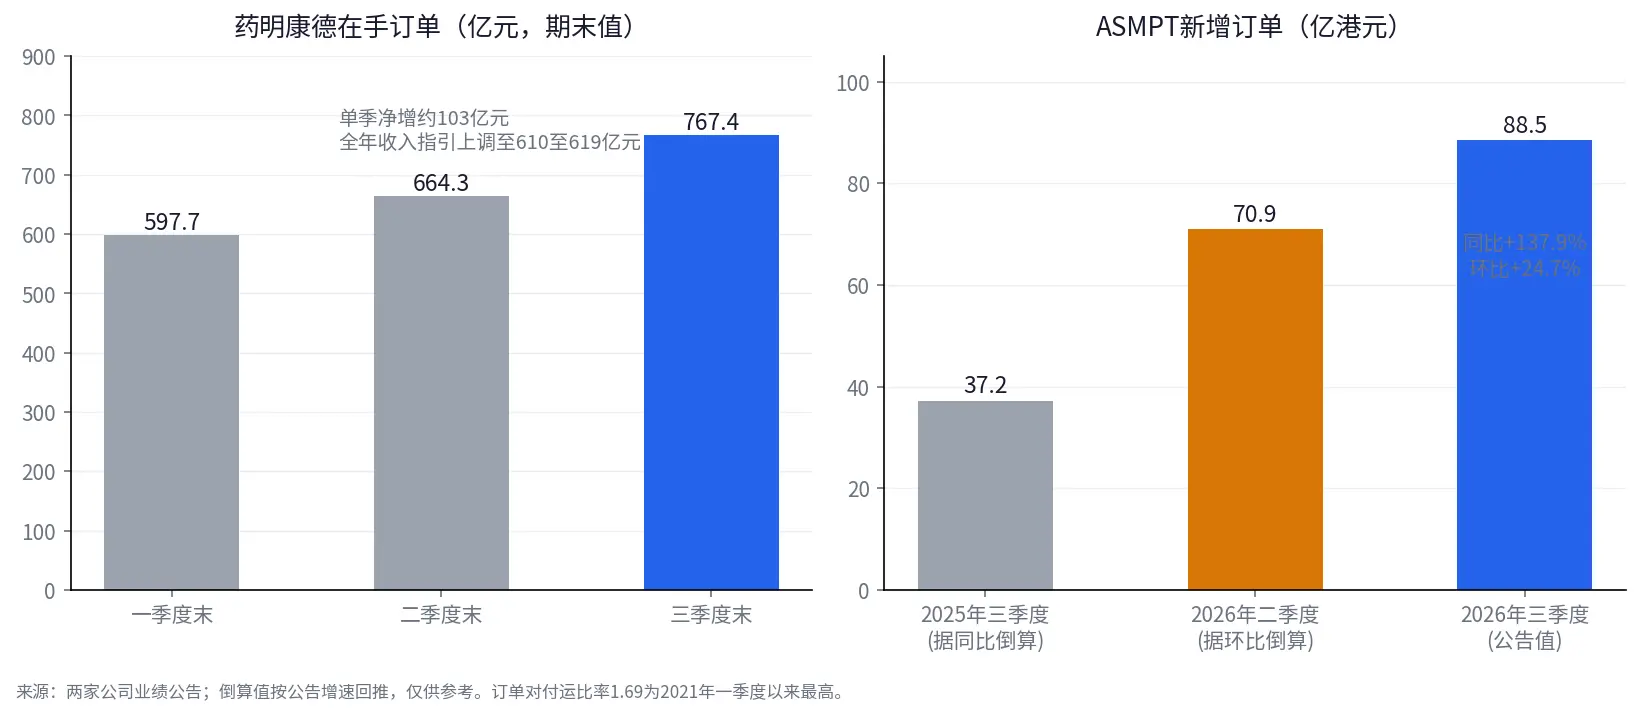
WuXi AppTec's backlog increased by approximately 17 billion yuan in the second and third quarters, while ASMPT's new orders reached a historical high in the quarter, with the calculated value reflecting the announced growth rate.
ASMPT's order data is even more remarkable. The company announced its third-quarter results on October 28, with sales revenue of 5.247 billion Hong Kong dollars, a year-on-year increase of 48.7%. The total amount of new orders was 8.845 billion Hong Kong dollars, a year-on-year increase of 137.9%, setting a historical high, with a quarter-on-quarter increase of 24.7%. The order-to-delivery ratio reached 1.69, the highest level since the first quarter of 2021. The company expects fourth-quarter revenue to be between 670 million and 730 million US dollars, which, based on the midpoint of the guidance range, represents a quarter-on-quarter increase of approximately 4.6% and a year-on-year increase of approximately 37.5%.
These data provide more direct evidence of demand in the AI supply chain than conceptual narratives. For AI investments to translate into revenue for supply chain companies, it ultimately requires customers to place orders, deliver equipment, and recognize revenue. ASMPT's new orders and fourth-quarter guidance at least provide a trackable basis for business performance in the coming quarters. However, the company also cautioned that the orders include one-time large orders and that extended delivery cycles have prompted customers to place orders in advance. In other words, while order growth is a genuine business signal, it should not be mechanically interpreted as future revenue increasing by 137.9% year-on-year.
Market reactions have not been uniformly positive. WuXi AppTec opened more than 4% higher after its earnings report on October 27, and rose about 2.2% by 3:45 PM on October 28. ASMPT opened nearly 5% higher on the day of its earnings announcement but then fell back in the afternoon, closing at 117.3 Hong Kong dollars by 3:45 PM, down about 3.2% from the previous day's closing price. This reminds investors that even if operational metrics improve, stock prices still depend on whether these improvements exceed prior expectations, whether valuations have already reflected them, and how investors assess the pace of future order fulfillment.
The commonality between WuXi AppTec and ASMPT is that they provide operational variables that can be continuously tracked, namely order scale, revenue guidance, and cash flow expectations. Their differences lie in that WuXi AppTec's backlog more directly reflects future business volume to be executed, while ASMPT's new orders require further observation of delivery cycles, customer advance orders, and product structure. In the next phase, whether orders can be converted into revenue, whether revenue can be converted into profit, and whether profit can be converted into cash flow will be key to assessing the quality of growth.
6. China Shenhua's Explanation: The Market Rewards Not Only Growth but Also Visible Cash Returns
If Hengrui, WuXi AppTec, and ASMPT represent different forms of growth, then China Shenhua provides another pricing logic: growth does not have to be rapid, as long as current earnings and shareholder returns are sufficiently clear, it can also be attractive.
China Shenhua's net profit attributable to the parent company in the third quarter was 15.688 billion yuan, a year-on-year increase of 3.2%, with net profit after deducting non-recurring items increasing by 10.6% year-on-year. In the first three quarters, the company's operating revenue reached 296.031 billion yuan, a year-on-year increase of 9.0%, and the net profit attributable to the parent company was 44.403 billion yuan, a year-on-year increase of 3.8%, with a net cash flow from operating activities of 92.7 billion yuan, a year-on-year increase of 23.1%. Based on the dividend ratio for 2025, as of October 26, the company's dividend yield was approximately 4.52%.
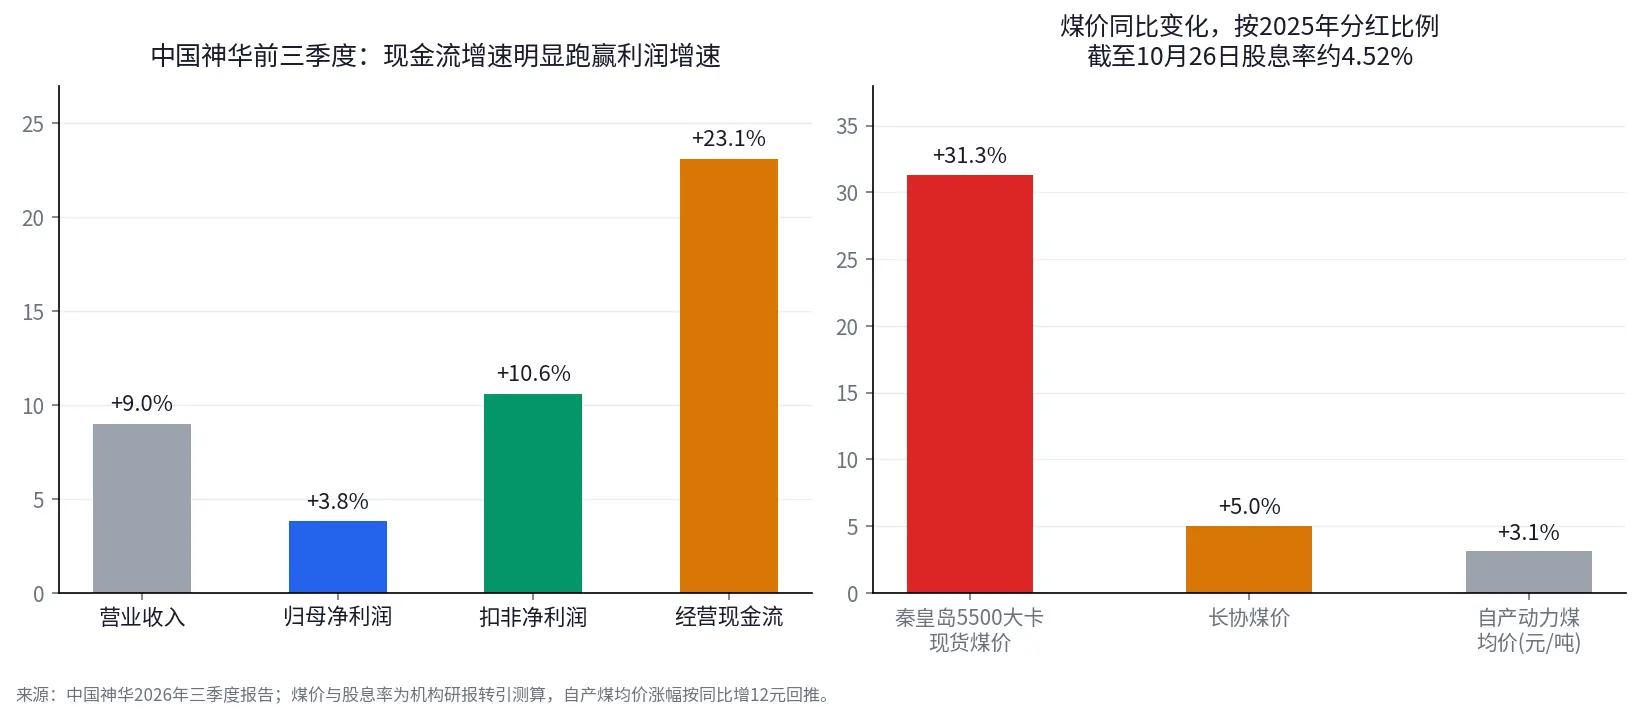
In the first three quarters, China Shenhua's cash flow growth significantly outpaced profit growth, with the right chart showing the year-on-year changes in coal prices and dividend yield levels.
Compared to innovative drugs and AI supply chain companies, China Shenhua does not need to rely on high-speed growth to prove its entire investment value. For such assets, investors are more concerned about changes in coal and electricity prices, the stability of long-term contracts, capital expenditures, and whether operating cash flow can cover dividends. The spot price of Qinhuangdao 5500 kcal thermal coal increased by 31.3% year-on-year, and the long-term contract price rose by 5.0%, providing support for cash flow from the price side. A relatively moderate profit growth rate does not necessarily mean a decline in investment attractiveness. When cash flow is stable, capital allocation is disciplined, and dividends are sustainable, investors may still be willing to pay a price for current returns.
However, high dividends also need to be validated. Declining commodity prices, rising capital expenditures, or a sustained drop in profits could weaken future dividend capacity. The dividend yield is a return metric calculated based on the current stock price, which does not guarantee future dividends. What truly matters is how much sustainable free cash flow the dividends come from and whether the company needs to sacrifice necessary investments to maintain payouts.
The difference between China Shenhua and Hengrui, WuXi AppTec lies in the different questions they need to answer. Growth companies must prove that future profits can be realized, while cash return companies must demonstrate that current earnings can be sustained. The market is reassessing growth, risk, and cash return certainty among different assets, and a simple dichotomy of growth versus value cannot encapsulate this shift.
7. Realizing "Verifiable Premium": Each Company Must Provide Different Answers
Putting these cases together clarifies the logic behind the divergence in financial reports. The market does not uniformly reward high profit growth, nor does it uniformly reward orders or high dividends. It seeks to identify which metric best demonstrates the company's growth or returns and can continue in a manner consistent with market expectations.
|--------|-----------------------|---------------------------| | Company | Surface Signal | Next Most Worthwhile Variable to Verify | | HSBC Holdings | Pre-tax profit growth of 32% | After excluding one-time items, can core profit and revenue continue to improve? | | Contemporary Amperex Technology Co., Ltd. | Revenue growth of 58.58% | Can profit margins and operating cash flow catch up with revenue growth? | | Hengrui Medicine | Net profit attributable to parent company growth of 88.92% | Can sales of innovative drugs and external licensing jointly support subsequent profitability? | | WuXi AppTec | Backlog of orders of 76.74 billion yuan, a year-on-year increase of 36.4% | Can orders continue to convert into revenue, profit, and cash flow? | | ASMPT | New orders growth of 137.9% | Can AI-related orders be delivered as expected, avoiding fluctuations from advance orders? | | China Shenhua | Net profit attributable to parent company growth of 3.2% | Can operating cash flow, commodity prices, and dividend capacity remain stable? |
The value of this framework lies in informing investors about what to look for next; it cannot directly predict individual stock performance based on a single number. High profit growth does not guarantee that future profits will be higher. Rapid order growth does not mean all orders will be delivered on time. Strong cash flow does not guarantee that dividends will always be stable. Different metrics answer different questions, and only when placed within the context of the company's business model, balance sheet, and valuation expectations can a complete judgment be formed.
It should also be emphasized that stock prices reflect changes relative to expectations, which is far more complex than simply scoring financial reports. Even if a company's performance grows, if it falls short of market expectations, the stock price may still decline. Conversely, even if the current growth rate is not high, as long as the operational situation is better than pessimistic expectations, the stock price may rise. The so-called verifiable premium does not mean the market is only willing to pay for cash flow or orders; rather, it indicates that when valuations are under pressure and capital becomes cautious, investors will pay more attention to the sources of growth, the paths to realization, and sustainability.
The current adjustment in Hong Kong stocks mainly reflects overall valuation and funding environment pressures. The divergence in individual stock performance depends more on the relationship between profit expectations, growth quality, and valuations. The net outflow of southbound funds during this phase indicates the funding environment at that time but is insufficient to prove that the market has completed a long-term shift from growth to value. To confirm this change, further observation of subsequent capital flows, relative sector performance, and whether stock prices can maintain reactions after companies release financial reports is needed.
In conclusion: In the next round of financial reports, what will be tested is not growth rate but the ability to realize it.
HSBC, Contemporary Amperex Technology Co., Ltd., Hengrui Medicine, WuXi AppTec, ASMPT, and China Shenhua represent six different operational and pricing scenarios. HSBC needs to prove that core profit improvement is not just a base effect, Contemporary Amperex Technology Co., Ltd. needs to ensure that revenue, profit, and cash flow form a more reasonable match, Hengrui needs to demonstrate that licensing revenue and innovative drug sales can jointly support profitability, WuXi AppTec and ASMPT need to convert orders into revenue and cash flow, while China Shenhua needs to prove that current cash returns are sustainable.
None of these companies can draw final conclusions based solely on a single quarter's figures. However, they collectively indicate a change worth continuous tracking: in a market under valuation pressure, growth remains important, but investors increasingly need to know how that growth will be realized.
Moving forward, whether Contemporary Amperex Technology Co., Ltd.'s operating cash flow can recover, whether WuXi AppTec's orders can continue to convert, whether ASMPT's high orders can be realized as subsequent revenue, and whether Hengrui's innovative drug business can maintain growth will all provide new evidence for this judgment. If subsequent financial reports show that profit growth driven by one-time factors can still receive a valuation response equal to core operational improvements, then the explanation of verifiable premium will need to be revised. What the market ultimately rewards is not determined by a single concept but must be answered by the next financial report.
Data Explanation
HSBC Holdings' third-quarter performance and stock price reaction: Company earnings announcement, 21st Century Business Herald, China News Network, October 27 to 28, 2026
Hengrui Medicine, WuXi AppTec, and China Shenhua's third-quarter reports: Company announcements, Xinhua Finance, Shanghai Securities Journal, October 23 to 27, 2026
Contemporary Amperex Technology Co., Ltd.'s third-quarter report, earnings briefing, and quarterly cash flow breakdown: Company announcements, Caijing.com, Phoenix Finance, Sohu Finance, October 20 to 23, 2026
ASMPT's third-quarter performance: Company earnings announcement, Caihua News, Zhitong Finance, October 28, 2026
Coal Price and Dividend Yield Calculation: Research Reports from Everbright Securities and Other Institutions (Cited), October 26 to 27, 2026
Hang Seng Index, Hang Seng Tech Index, and Southbound Capital: Public Market Statistics, October 20 to 23, 2026, Hang Seng Tech closing points verified by market data
Disclaimer: The content of this article is for general information and market commentary only, compiled based on publicly available information as of the time mentioned in the text. Relevant market data and expectations may change with market conditions. The views and investment strategies cited from third-party institutions, analysts, or other individuals only represent the views of the relevant third parties at a specific time and do not represent the views or recommendations of BIT. This article does not constitute investment advice, investment research, solicitation, or a recommendation for any securities, investment products, or trading strategies, nor should it be the basis for any investment decisions. Financial markets carry risks, and securities prices and market performance may fluctuate; past performance and historical market trends do not represent or guarantee future results. Investors should independently assess the relevant risks based on their own circumstances and seek professional advice when necessary. BIT's Hong Kong stock trading services are not offered to residents of Hong Kong or users in other restricted jurisdictions.
 Risk warning Risk warning




Popular articles