Who rose 25% and who only rose 2% three days after Anthropic filed? How does the listing drive the industry chain?

The prospectus data is as of June 30, 2026 (S-1 submitted on October 26, 2026), and the market and financial report data is as of the close of U.S. stocks on October 28, 2026, Beijing time on October 29, 2026.
The S-1 prospectus reveals the true accounts of the AI industry chain.
From $807 billion in commitments to cash flow: Who gets paid first, who is funding, and where does the risk lie?
The market provided an answer in three days.
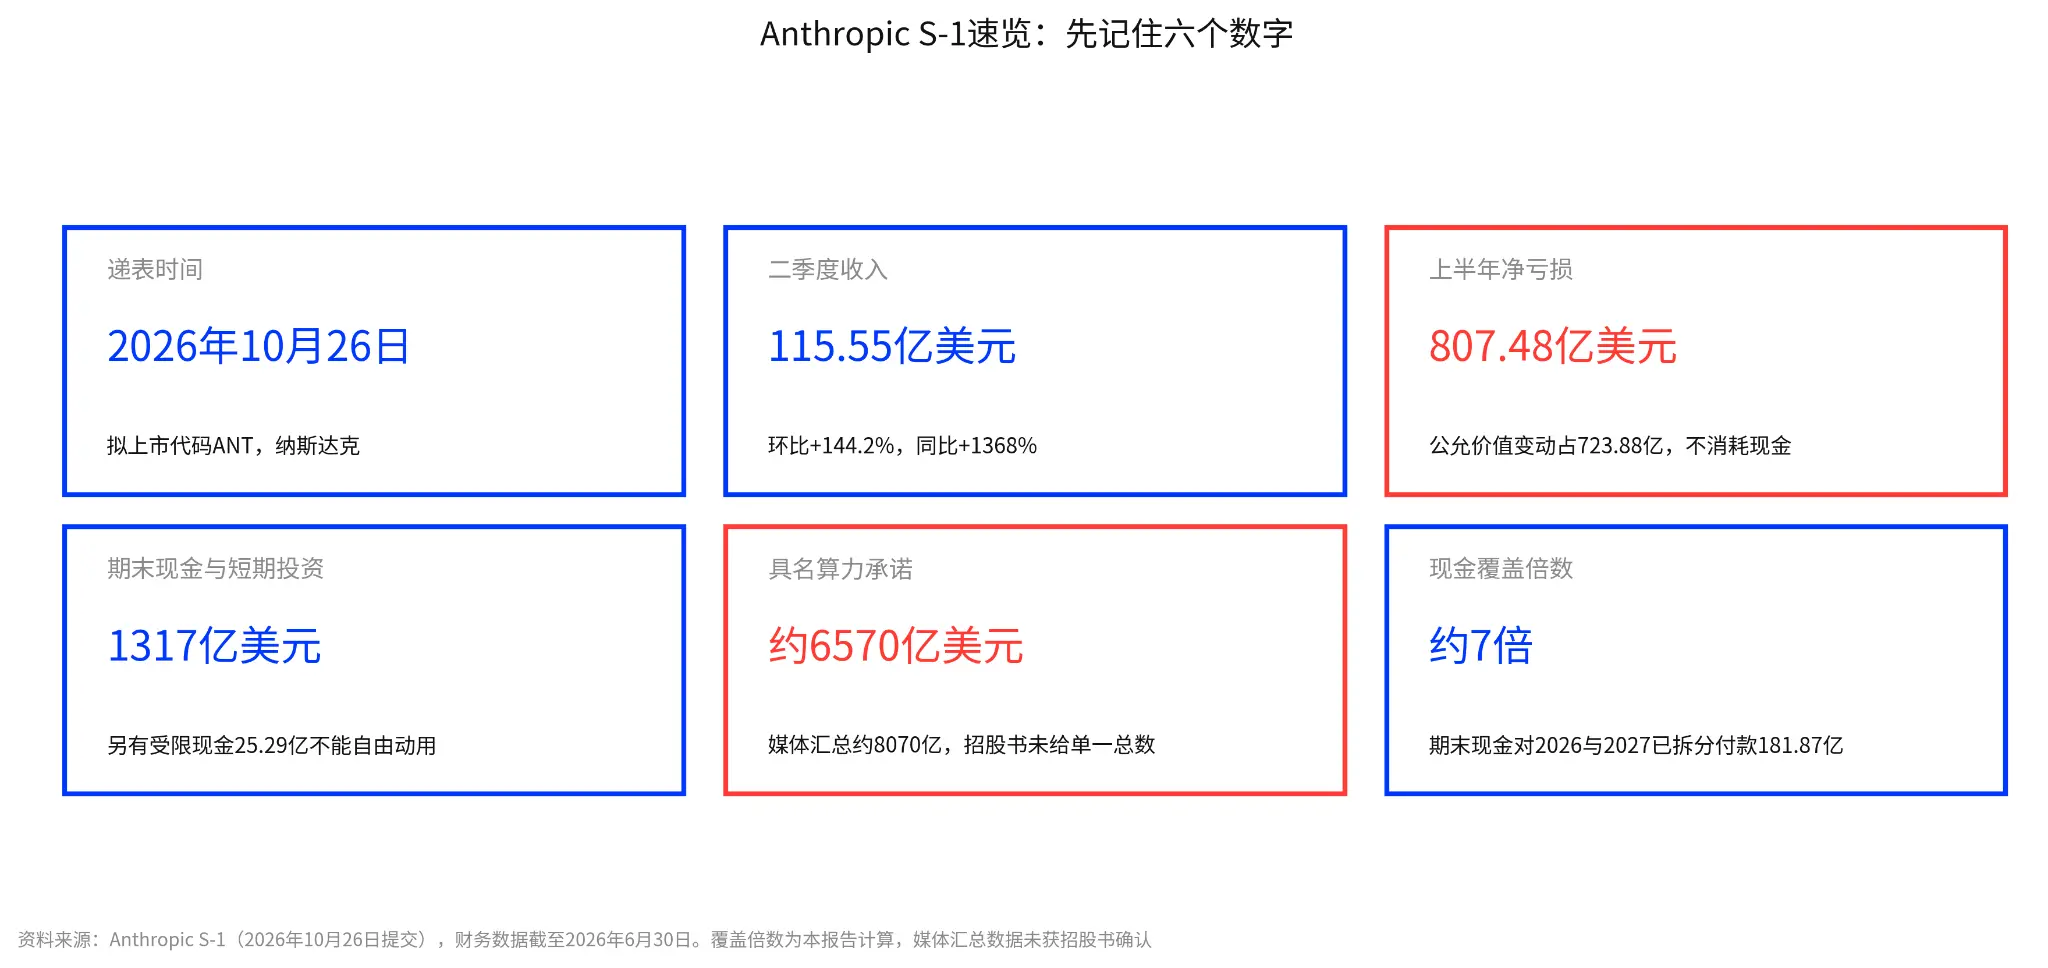
On October 26, Anthropic submitted its S-1 prospectus to the U.S. Securities and Exchange Commission, planning to go public on NASDAQ under the code ANT. The media quickly summarized a staggering figure: $807 billion in computing power commitments.
Three trading days later, the ranking of price increases provided a counterintuitive answer: Vertiv (power cooling equipment) rose 25.0%, CoreWeave (GPU cloud services) rose 17.9%, Oracle rose 14.4%, Broadcom rose 9.4%, while NVIDIA only rose 2.1%.
This ranking overturned common sense. Chips are the largest component, but NVIDIA only rose 2.1%. Instead, the power equipment supplier Vertiv surged by 25%. The market is voting with its feet: the extent of the increase does not look at the amount of commitments but at whose orders can be verified first and whose payments can be realized first.
Key Points
· A main line: This S-1 shifts the pricing basis of the AI industry chain from narrative to contracts and cash flow: In the three trading days since the filing, the market has been repricing according to the order of verification, with Vertiv up 25.0% and NVIDIA only up 2.1%. It is not the one with the largest commitment amount that rises, but those whose orders and payments are verified first. The commitment amount determines who is in the chain, while orders and payments determine who gets priced.
· Money has been spent; who caught it: Anthropic's second-quarter revenue was $11.555 billion, a 144% quarter-over-quarter increase. Cloud vendors funded $90.7 billion in a single quarter, and Google's free cash flow turned negative. The cloud layer caught the revenue but needs to buy chips and power from downstream.
· Who gets paid first, who funds first: At the chip level, Broadcom is both a seller and a funder ($161.2 billion in rent plus $63 billion in SPV), while at the power level, Vertiv's orders doubled but it has the most payment links. The application software does not receive money from Anthropic but from the workflow budgets of end customers.
· The other side of the bill: In the first half of the year, the net loss of $80.748 billion was largely due to fair value changes, with operating cash flow positive at $3.929 billion. The $131.7 billion in cash covers about 7 times the two-year payments but only about 20% of the $657 billion in contracts. The gap is filled by operating cash and continuous financing, with risks concentrated on those who signed irrevocable contracts.
On October 26, Anthropic submitted its S-1 to the U.S. Securities and Exchange Commission, planning to go public on NASDAQ under the code ANT. The market's first glance saw the media's summary of approximately $807 billion in computing power commitments, but the prospectus did not provide this single total, and the sums reported by various media outlets were inconsistent. The market reacted ahead of the issuance: from the close on October 23 before the filing to the close on October 28, Vertiv rose 25.0%, CoreWeave rose 17.9%, Oracle rose 14.4%, Micron rose 12.0%, Broadcom rose 9.4%, and NVIDIA only rose 2.1%.
Filing is just the first step. The truly useful question for investors is: which layer will the money flow to, and what should be monitored in advance? This article unfolds along a funding chain: first looking at who catches the money after Anthropic spends it; then examining among those who catch the money, who receives cash first and who funds first; then returning to Anthropic's own bills and contracts to see where the risks lie; and finally asking how many assumptions have already been prepaid in the current price.
1. A "spend money first, make money later" prospectus
Anthropic's revenue and commitments both surged, but their nature is different. Revenue is a single quarter of turning a profit, while commitments are long-term minimum guarantees; the market has already voted based on "the strength of order and payment verification," rather than the scale of commitments:
Revenue is surging, but a single quarter of turning a profit does not equal half-year profitability: The S-1 shows that revenue increased from $376 million in Q1 2025 to $11.555 billion in Q2 2026, a quarter-over-quarter increase of 144.2% and a year-over-year increase of 1368%. During the same period, computing power and infrastructure costs increased by 300%, with revenue growth over four times the cost growth; GAAP operating profit was $974 million, with a profit margin of 8%, and the profit turnaround occurred in the most recent quarter. The total operating loss for the first half of the year was still $693 million.
The scale of commitments is larger, but only confirmed numbers are considered: The eight named computing power arrangements in the S-1 roughly total about $657 billion, with an additional TPU computing power of $125 billion to $150 billion whose price is yet to be determined; the media summarized about $807 billion, but the prospectus did not provide this single total. What can be confirmed is that fixed or minimum guarantee commitments are about $265.6 billion, with a maximum term of 20 years, approximately 13.5 times the revenue of $19.708 billion over the past twelve months; according to the rough total of the eight named, it is about 33 times. This prospectus still speaks of spending money first and making money later. The market has already voted. In the three trading days since the filing, the ranking of price increases did not follow the commitment amounts but followed the strength of order and payment verification. Vertiv's earnings report night single-day increase of 16.48% contributed to most of the increase, while NVIDIA was pressured by expectations of diversion from major customers' self-developed products. Once the official listing price is set, this round of ranking will have a clear reference, and valuations will be related.
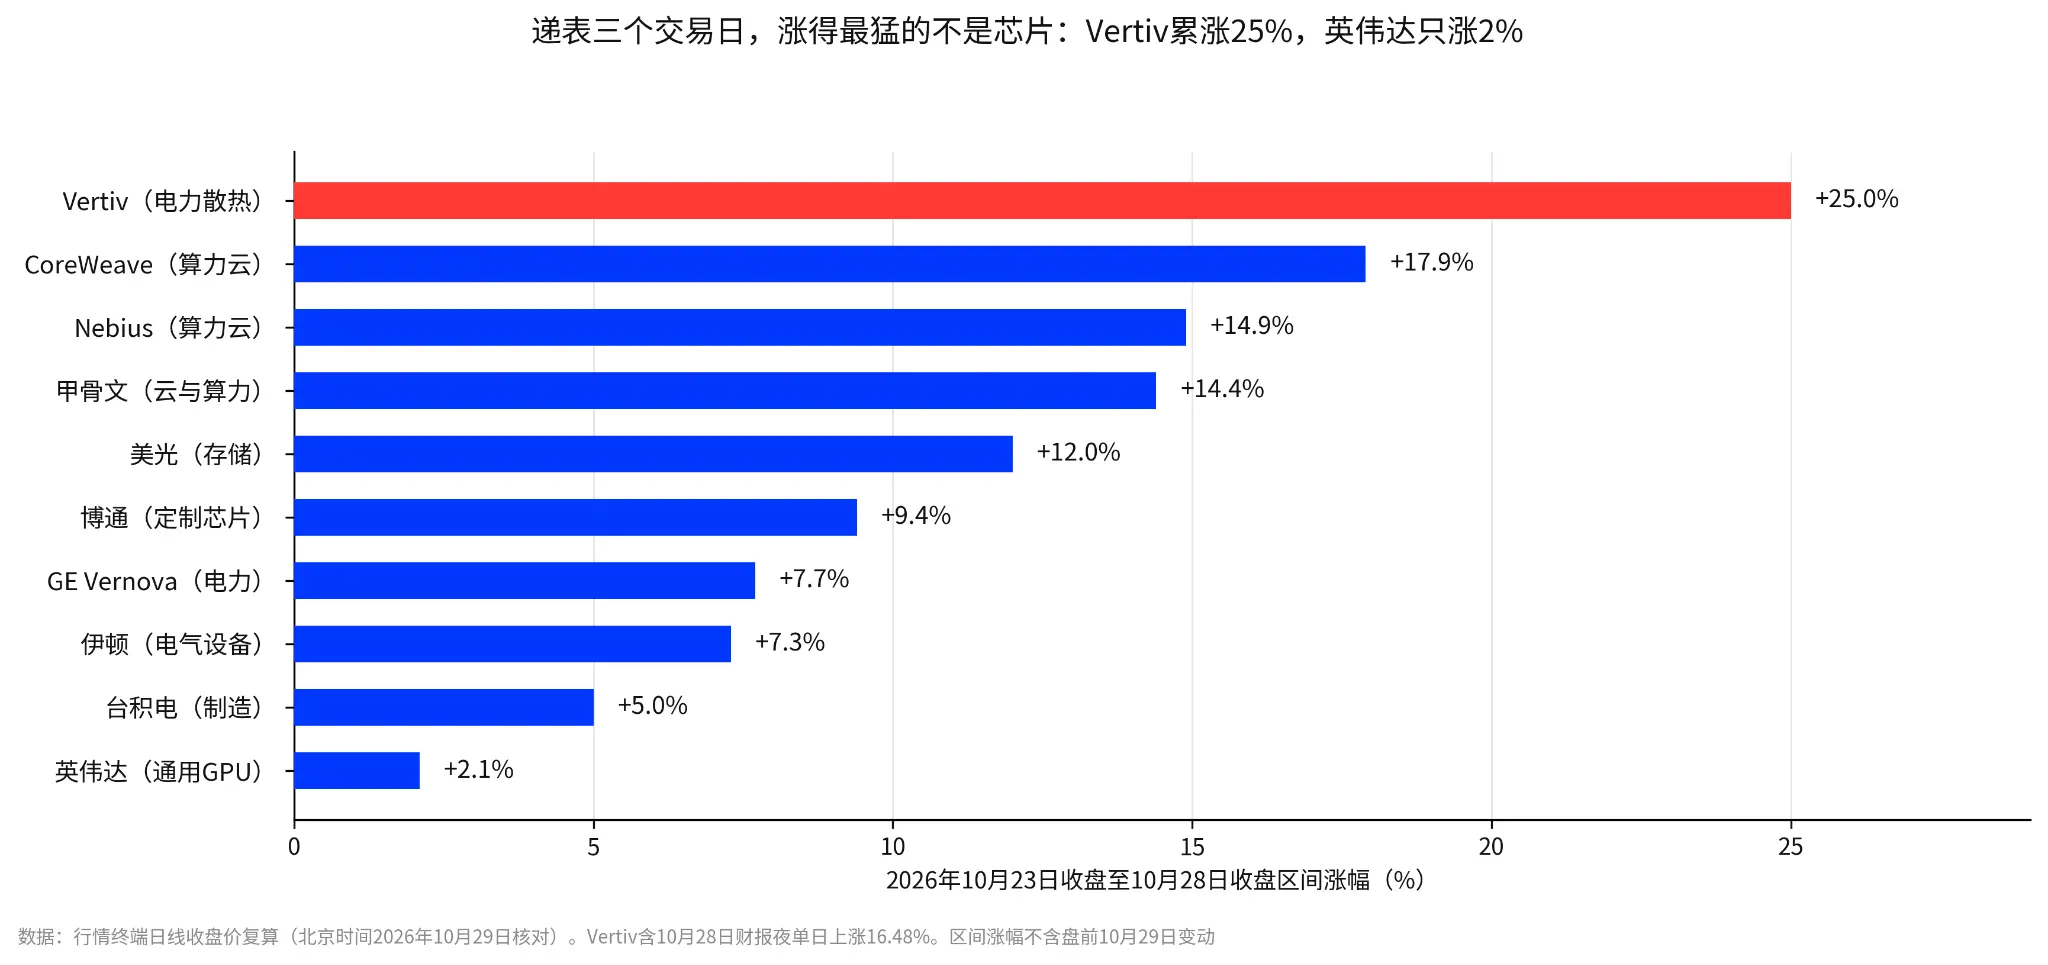
In the three trading days since the filing, the biggest gainers are not chips: Vertiv rose 25%, while NVIDIA only rose 2%.
The market has already voted; the biggest gainers are not chips. In the three trading days after the filing, the ranking of price increases followed the strength of order and payment verification, not the commitment amounts: Vertiv rose 25.0%, CoreWeave rose 17.9%, Oracle rose 14.4%, Micron rose 12.0%, Broadcom rose 9.4%, and NVIDIA only rose 2.1%. Vertiv's earnings report night single-day increase of 16.48% contributed to most of the increase; NVIDIA was pressured by expectations of diversion from major customers' self-developed products. The official listing price will provide a clear anchor for this round of ranking, and how this anchor translates into valuation will be explored in Chapter 5.
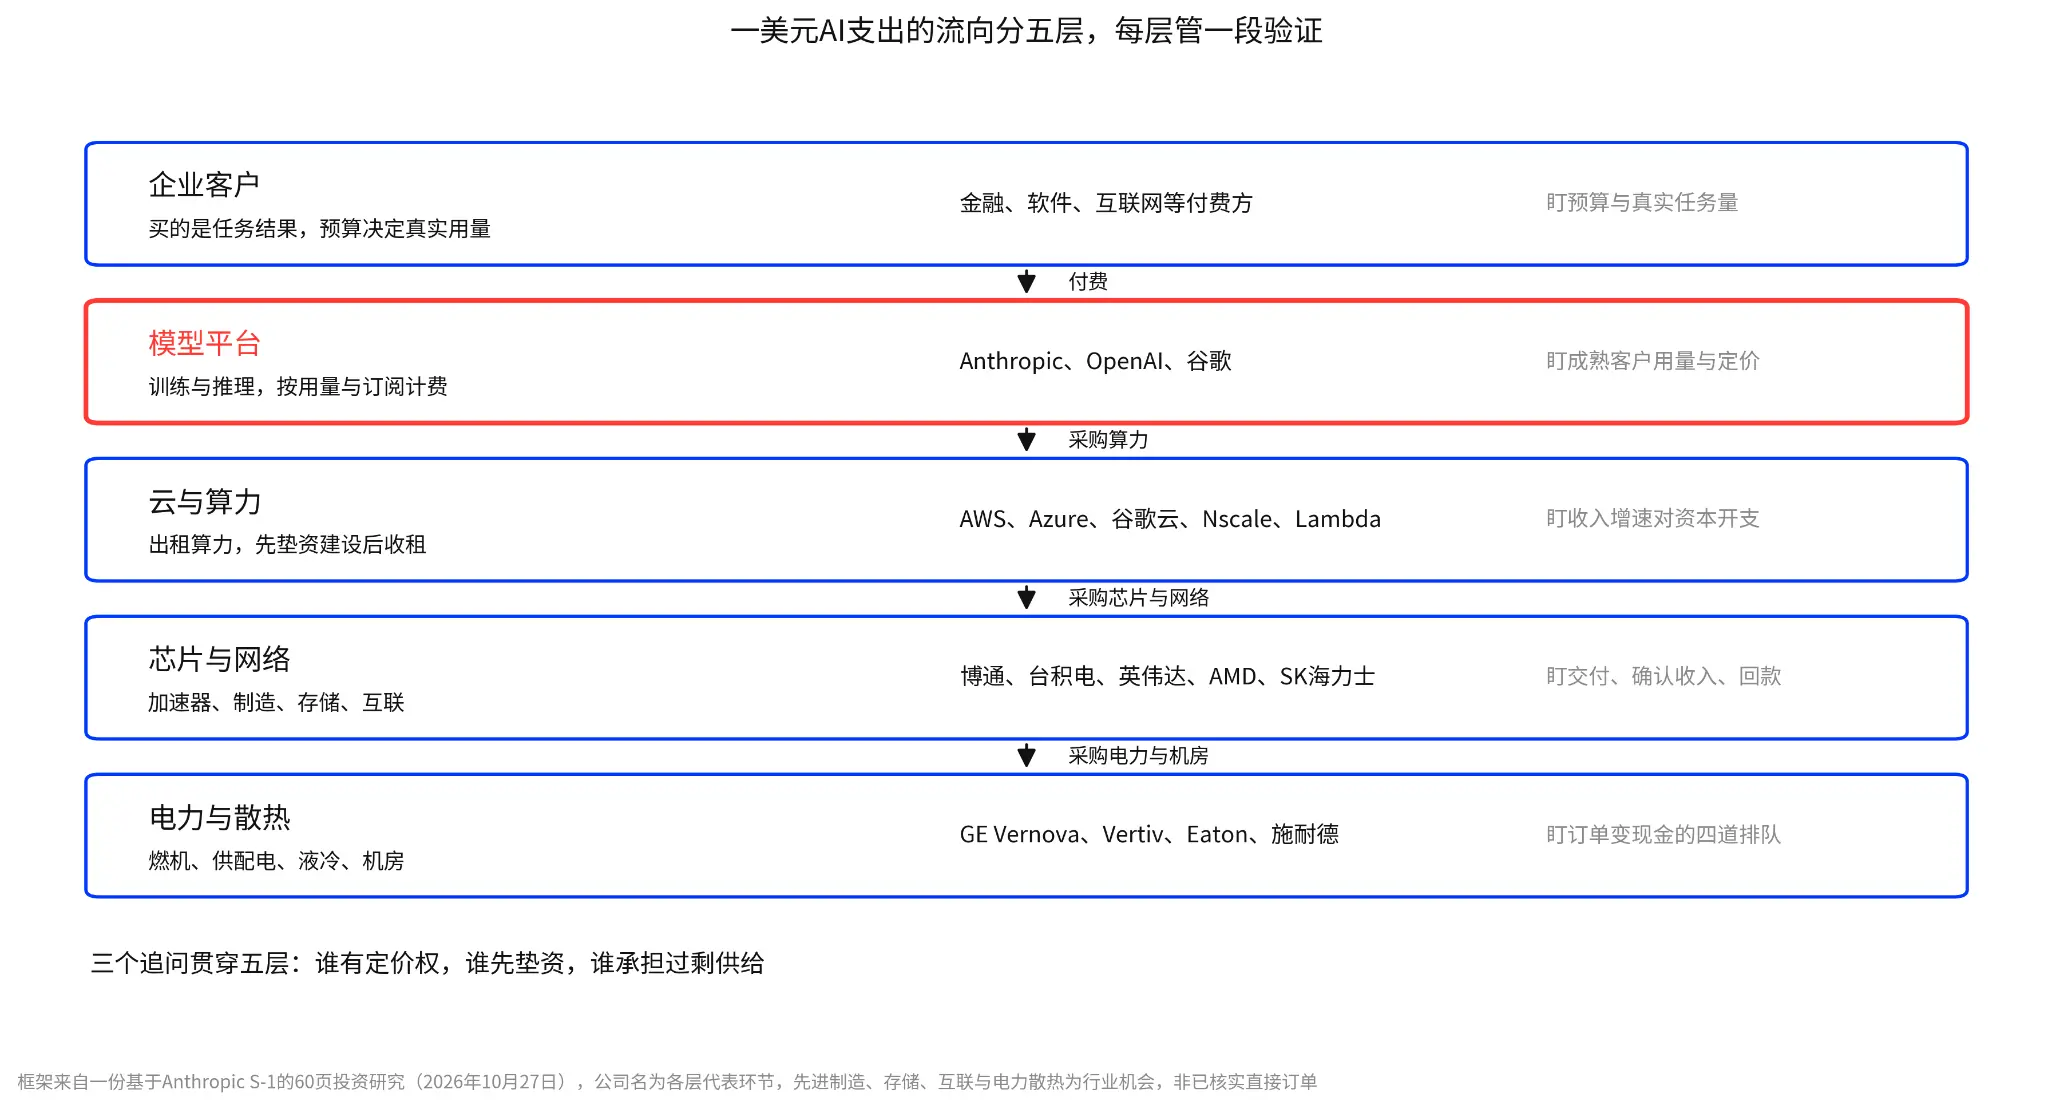
The flow of every dollar spent on AI is divided into five layers, each managing a segment of verification.
Enterprise customers pay the model platform, the model platform purchases cloud and computing power, the cloud and computing power then purchase chips, storage, and networks, followed by power and cooling, with the outermost layer being application software. Each layer asks three questions: Who has pricing power, who funds first, and who bears excess supply?
2. Money has been spent; who caught it?
How much money did the model layer receive, and how much did the cloud layer fund? The two layers are the two ends of the same money, and Anthropic's pay-per-use business model determines its revenue curve, which also determines the funding curve of cloud vendors. The model layer mainly needs to answer two questions: Did Anthropic's revenue surge come from new customer influx, increased spending from old customers, or price increases? Is the profit margin driven by price increases or efficiency improvements?
2.1. Model Layer: Revenue Outpaces Computing Costs for the First Time, Quality Depends on Customers and Retention
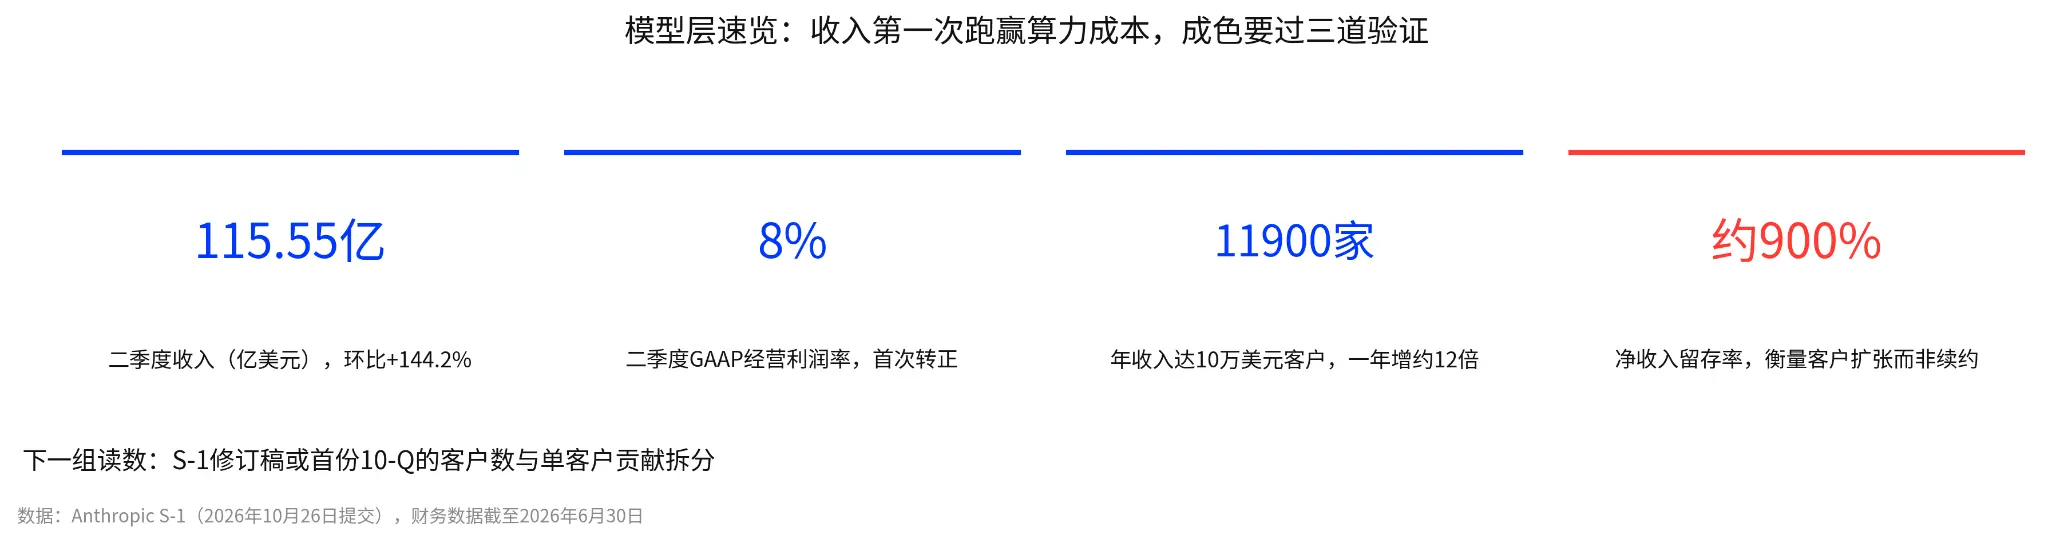
Model layer overview: Q2 revenue $11.555 billion, operating profit margin 8%, 11,900 customers, retention rate approximately 900%.
In terms of revenue structure, pay-per-use is the main model, with rapid version iterations. In the first half of the year, consumption-based (charged by token usage) revenue was $13.1 billion, accounting for 80%, while subscription-based revenue was $3.2 billion, accounting for 20%. The cost of a single task for Opus 5.5 decreased by about 40% compared to Opus 5 (according to Guo Xin Securities), which is the reason why revenue can outpace computing costs on the product side. Regionally, the U.S. accounts for about 72%, while overseas accounts for about 28%; over 80% of revenue comes from model versions released in the previous six months, and the revenue position of existing versions can be rewritten at any time.
Old customers spending more money is the main engine for revenue surging. The net revenue retention rate is approximately 900%, with the same batch of customers spending about nine times the baseline a year later. The proportion of revenue from the top five customers decreased from 36% in Q1 to 25% in the first three quarters, and in Q3 alone, it was only 21%, with no single customer exceeding 10%. This indicates that the revenue surge mainly comes from the expansion of usage by old customers; the new customer base is too small to support total revenue. If the growth rate of workload calls for intelligent agents slows down, revenue growth will also slow down.
Profit margin turning positive relies on improved unit computing output: Every $1 of computing power returned $0.40 in revenue in Q1 2025, rising to $2.08 in Q2 2026, an increase of 5.2 times (according to Guo Xin Securities based on S-1). Q2 revenue increased by 144% quarter-over-quarter, while computing costs increased by 300%. Costs appear to be rising faster, but unit economics are improving.
Improvements mainly come from continuous algorithm optimization and the automatic selection of more cost-effective computing power among different chips. Therefore, the profit margin turning positive is not due to price increases. The risk is: if multi-cloud scheduling space is exhausted and algorithm optimization yields diminishing returns, whether $2.08 can rise is the first variable for profit margins in 2027. Improving labor efficiency is another aspect: by September 2026, over 90% of the codebase was written by Claude, with revenue increasing by about 1200% over the past twelve months, while the number of employees only increased by about 170, raising annual revenue per employee from $1.4 million to over $6.6 million. The decrease in expense ratio relies on model improvements in labor efficiency, not on layoffs.
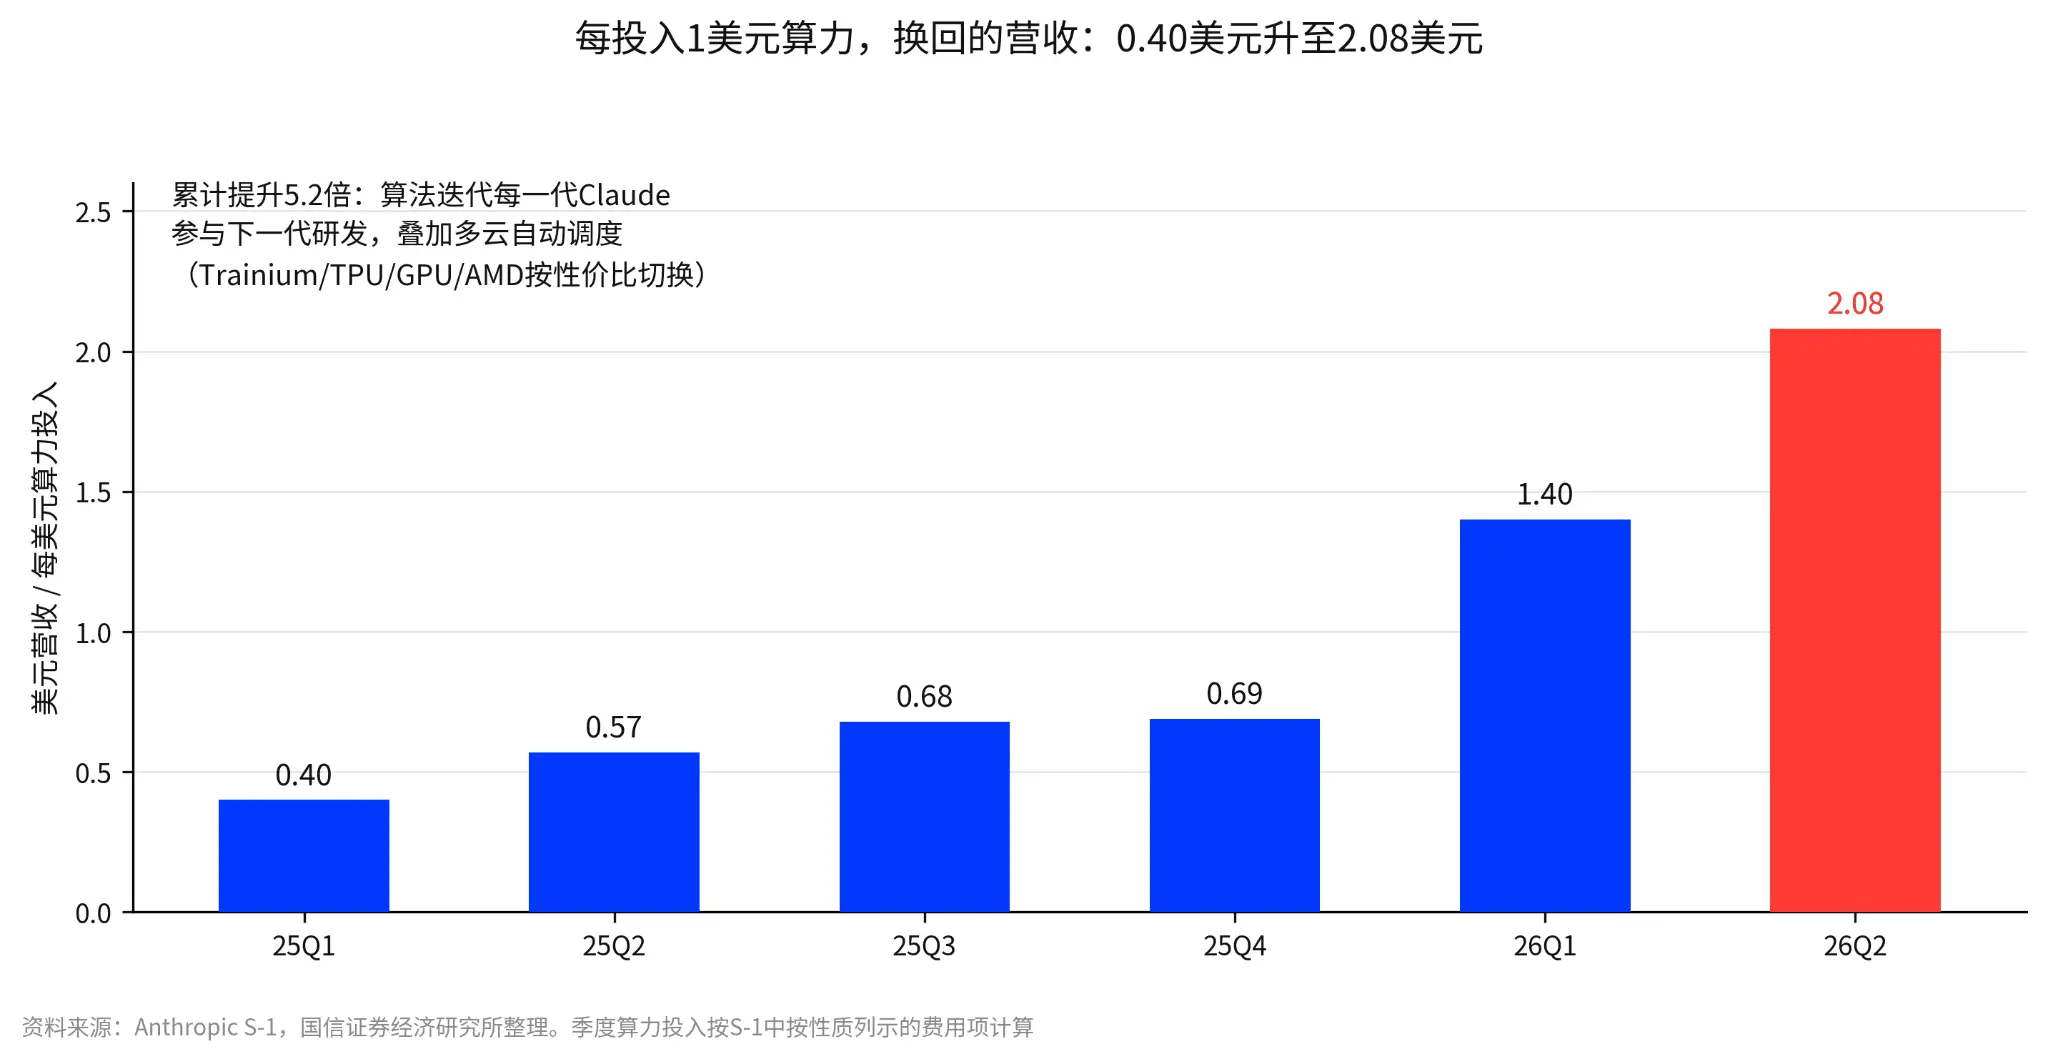
Revenue returned for every $1 spent on computing power: Six quarters from $0.40 to $2.08.
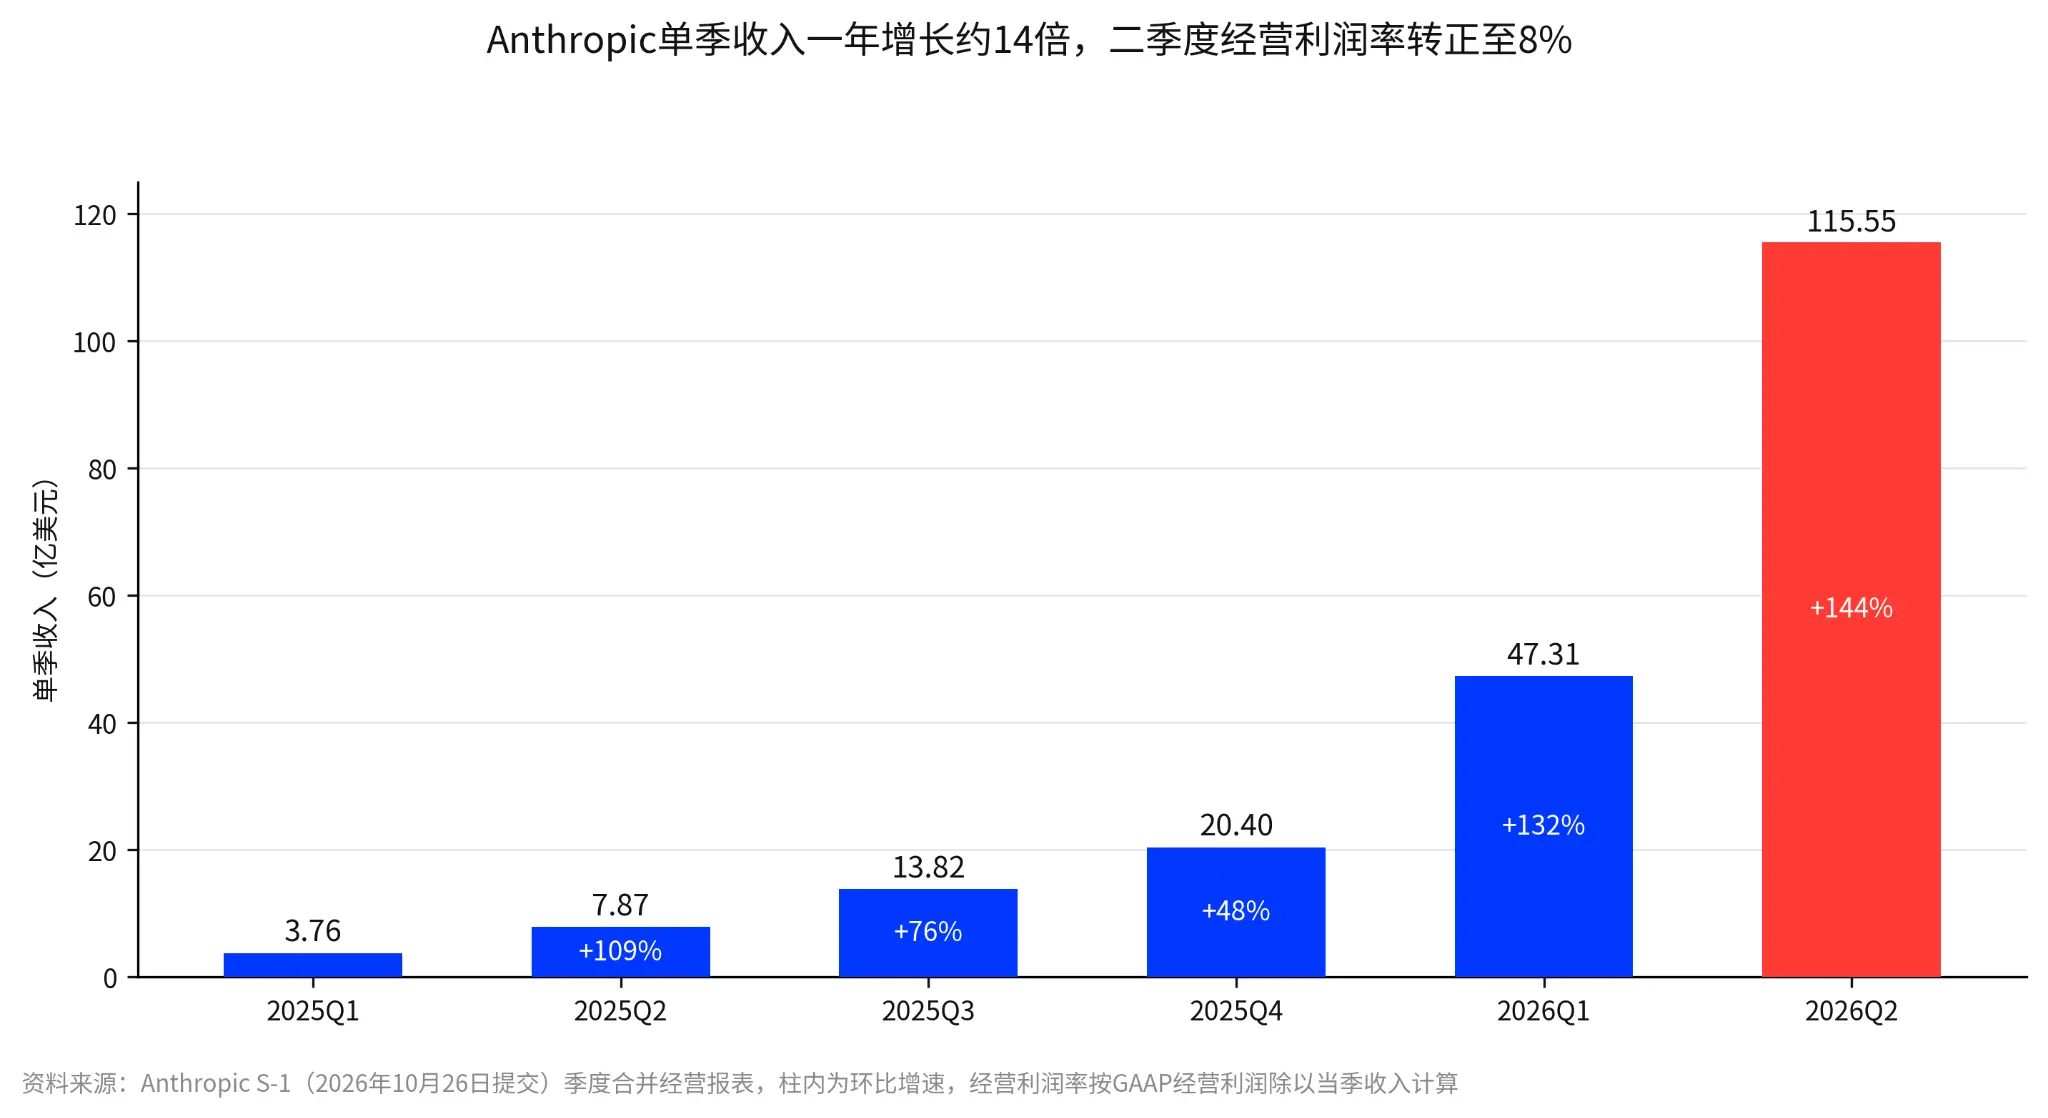
Anthropic's quarterly revenue grew about 14 times in a year, with Q2 operating profit margin turning positive to 8%.
The number of customers increased 12 times in a year, but the reliance on single customers has not been resolved simultaneously. Customers with annual revenue over $100,000 increased from about 950 to over 11,900, those over $1 million exceeded 1,900, and those over $10 million were about 250. In 2025, customers A and B each accounted for 12% of revenue, while in the first half of 2026, customer C accounted for 11%; the increase in the number of customers mainly improves diversification, but if customer C reduces usage in 2027, the revenue floor will still be more fragile than the number of customers indicates. The top five customers account for 25%, with no reliable industry benchmark, only a reference to its own trend of falling from 36%.
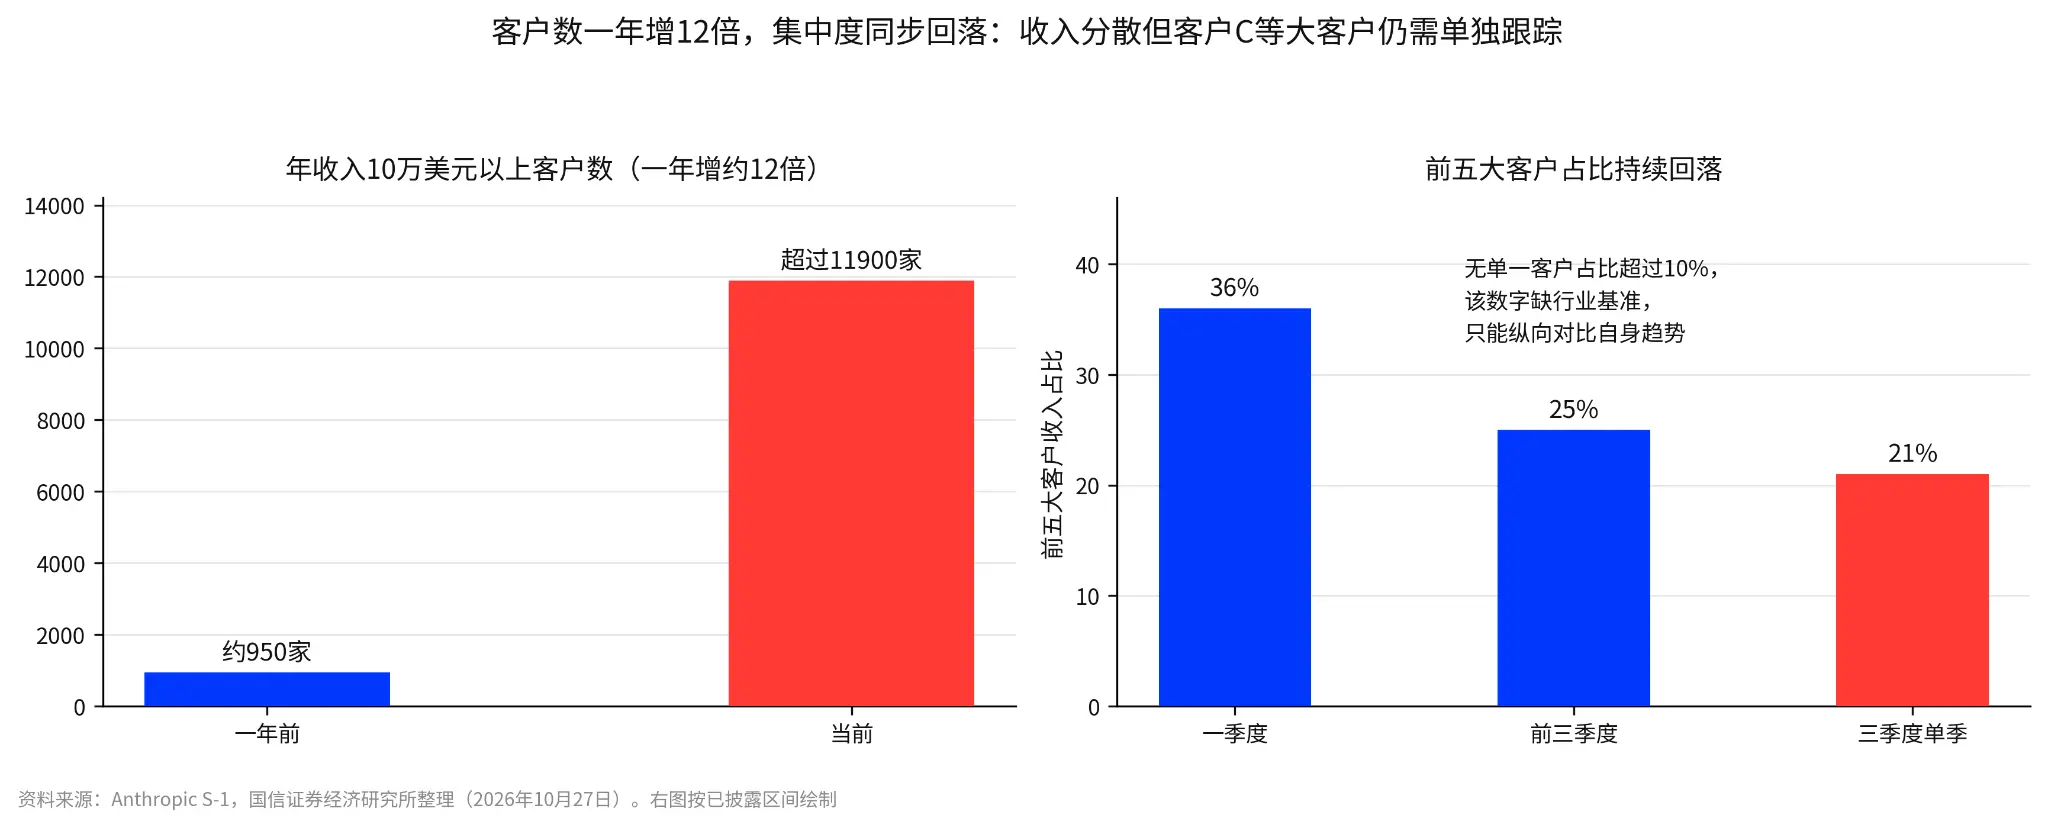
The number of customers increased 12 times in a year, while the proportion of the top five customers simultaneously declined: Diversification is improving, but reliance on single customers still needs to be monitored separately.
Customer retention rate of 900% needs to look at the base first: The standard SaaS net revenue retention rate is usually between 110% and 130%, and 900% is extremely high; however, this metric only covers the spending expansion of usage-based billing customers, while fixed-price Pro and Max subscribers are not included. A low base and early adoption ramp-up can also inflate the numbers. Therefore, 900% primarily indicates that customer usage is still ramping up and cannot be taken as evidence of loyalty. The key to assessing revenue sustainability is what level it falls back to after the ramp-up ends.
The cost side is also normalizing: Total expenses listed by nature are $16.979 billion, equivalent to 104% of revenue; among them, computing power is $8.945 billion (53%), personnel is $3.152 billion (19%), sales and marketing channels are $3.168 billion (19%), and others are $1.714 billion (10%). The total expenses for the year 2025 are equivalent to 276% of revenue, which has clearly fallen back now, driven by improved unit computing efficiency. The cost of revenue listed by function is $2.380 billion (gross margin 85.4%), which is only part of the computing power costs, with the rest in R&D and sales categories, and cannot be added to $16.979 billion. R&D expenditure is $9.741 billion, accounting for about 60% of revenue. As of June 30, remaining performance obligations are $10.8 billion, with about 75% to be recognized in the following 12 months; RPO only covers non-cancelable arrangements, and one cannot assert a funding gap solely because RPO is lower than total procurement.
Overall, the revenue engine at the model layer is the ramp-up of usage from existing customers, and the safety net is unit computing efficiency. If either of these two premises wavers, the contracts signed downstream will become less reliable.
2.2. Cloud Layer: Single-quarter capital expenditure of $90.7 billion, revenue growth must be viewed alongside capital expenditure
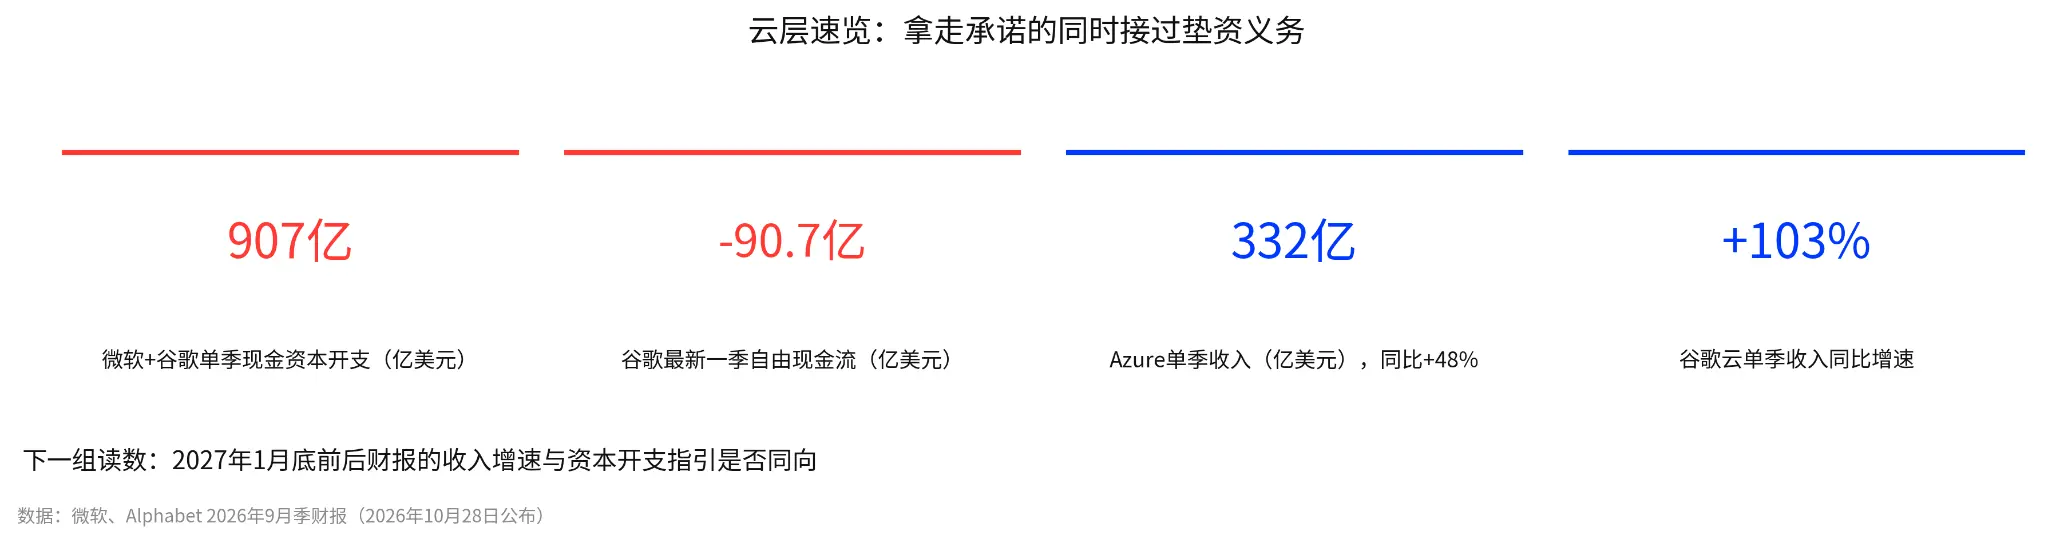
Cloud layer overview: Two companies had a combined single-quarter capital expenditure of $90.7 billion, with Google's free cash flow at -$9.07 billion.
Why are cloud vendors willing to advance funds? Because the contracts have minimum consumption clauses: insufficient amounts must be compensated, and they cannot be canceled except for major breaches. Cloud vendors are not betting on Anthropic's growth; rather, they are building capacity in advance based on Anthropic's commitment to minimum payments. Therefore, the risk of $90.7 billion is not on the demand side but on the delivery side: if capacity is built but usage is insufficient, Anthropic will compensate; if capacity construction is delayed, Anthropic's usage growth may be hindered by supply constraints.
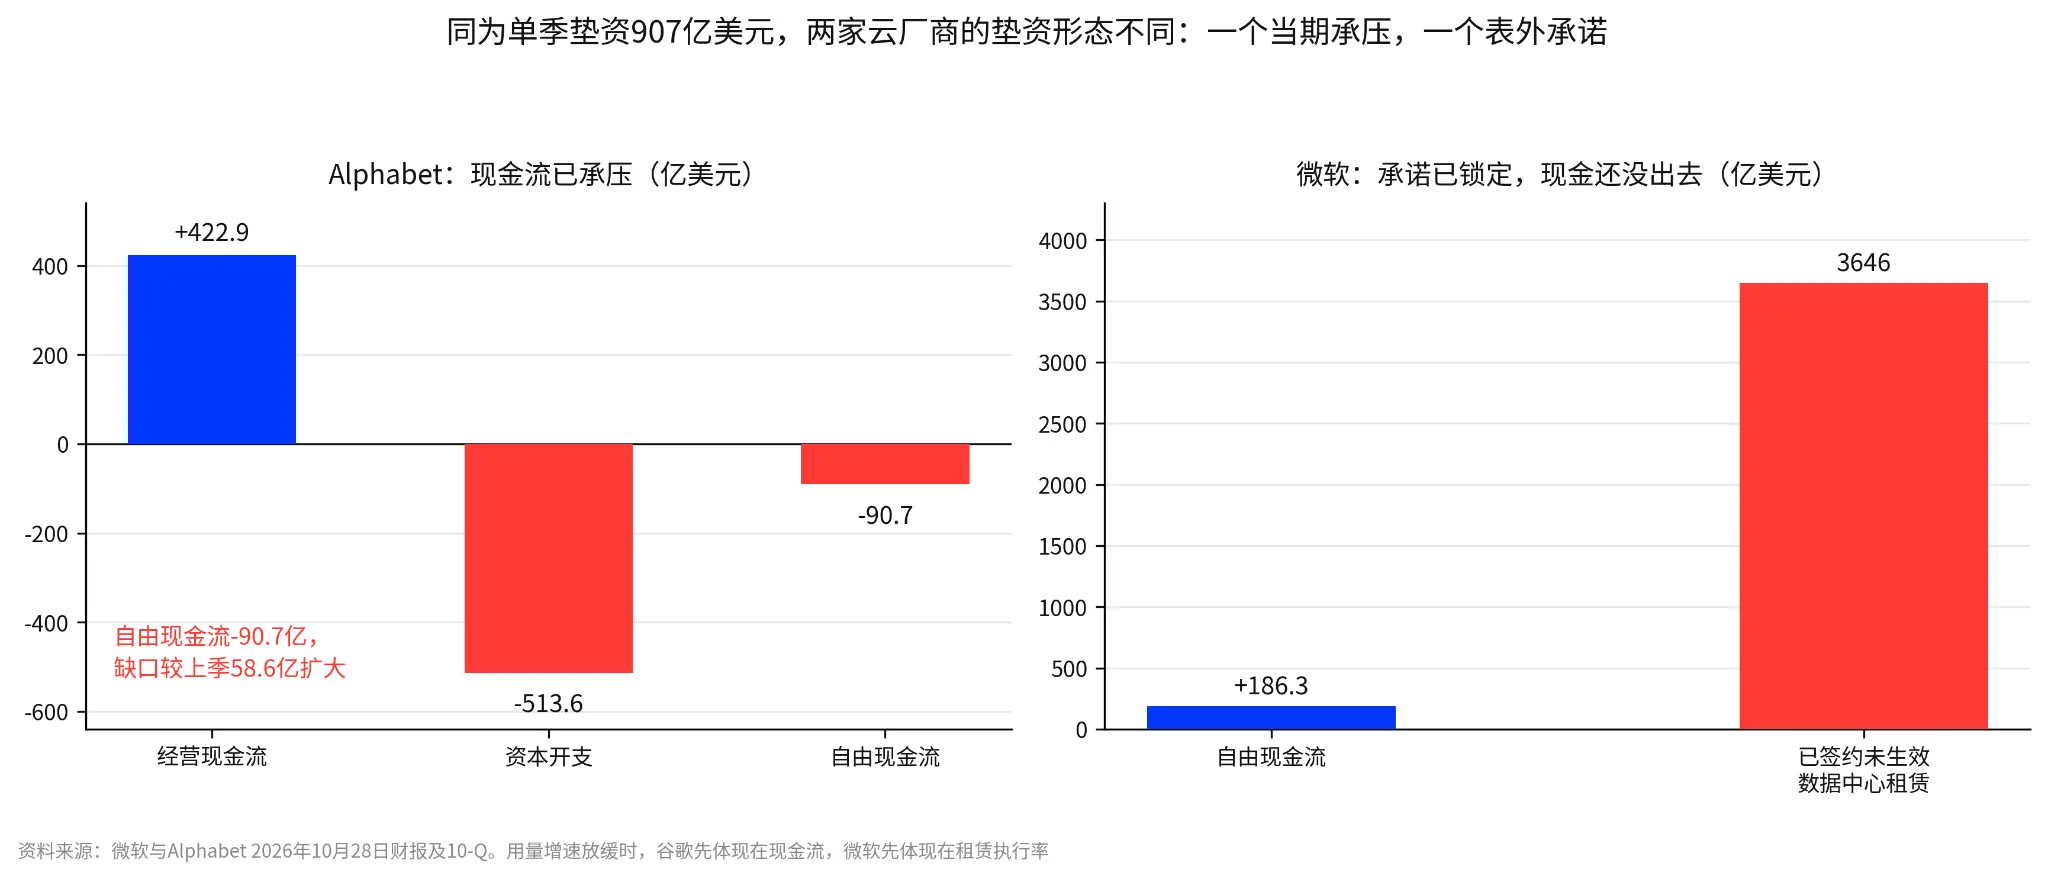
Both companies have a single-quarter capital expenditure of $90.7 billion, but their funding structures differ: Google is under pressure this quarter, while Microsoft has off-balance-sheet commitments.
Similarly, for single-quarter capital expenditure, the two companies have different structures: Google is under pressure this quarter, while Microsoft has off-balance-sheet commitments. The third-quarter report on October 28 shows that Microsoft and Alphabet had a combined cash capital expenditure of $90.7 billion for the quarter; among them, Azure revenue was $33.2 billion, up 48% year-over-year, and Google Cloud revenue was $30.7 billion, up 103% year-over-year. However, the pressure points for the two companies are different:
Alphabet is under pressure this quarter: operating cash flow for the quarter was $42.29 billion, capital expenditure was $51.36 billion, and free cash flow was negative $9.07 billion, with the gap continuing to widen from $5.86 billion in the previous quarter, and the advanced funds have consumed all remaining operating cash flow.
Microsoft's pressure is off-balance-sheet: free cash flow remains positive at $18.63 billion, but signed yet-to-be-effective data center leasing contracts amount to $364.6 billion, with advanced funds reflecting more as commitments rather than current cash.
If Anthropic's usage growth slows down by 2027, Google's pressure will first manifest in cash flow, while Microsoft's will first show in the execution rate of leasing contracts.
$90.7 billion is the current expenditure, while $807 billion is the long-term commitment, with the latter spread across multiple suppliers. This $807 billion corresponds to long-term computing commitments made by Anthropic as a single customer to multiple suppliers, not the expansion plans of any single cloud vendor. Based on the combined cash capital expenditure of $90.7 billion for the two companies, this commitment is roughly equivalent to the expenditure of both companies over nine quarters, and this is just the commitment from Anthropic as a single customer, distributed among multiple suppliers including Google Cloud, AWS, Microsoft, Broadcom, SpaceXAI, etc., and cannot all be attributed to any one cloud vendor. In the $90.7 billion capital expenditure of Microsoft and Alphabet, only a portion is for the early capacity expansion for large customers like Anthropic. There are two risks: if Anthropic's usage growth does not keep up, the reserved data centers, power, and equipment will become idle; at the same time, OpenAI and Google Gemini are also competing for the same power, land, and equipment, and which cloud vendor prioritizes resources will directly affect whether Anthropic can receive computing power on time.
The three cloud giants also have their own issues: Amazon relies on self-developed chips and cloud distribution synergy, with AWS revenue of $42.2 billion and operating profit of $16.6 billion in the second quarter, and multi-layer charges along the same customer path cannot be cumulatively added; Alphabet's TPU serves both internal Gemini and external Claude, with other income in the second quarter including $98 billion in unrealized gains from equity securities, which is non-operational; Microsoft's Azure combines enterprise software entry with computing power infrastructure, with Microsoft Cloud gross margin at 65% and declining year-over-year, with depreciation pressure already appearing in the gross margin.
The core point is whether the commitments can be fulfilled, with the main variable being the growth rate of model revenue, while the willingness to pay is secondary, as the minimum consumption clause has already locked in the willingness to pay in the contract. If the revenue growth rates of Google Cloud and Azure slow down in the next two quarters while both companies' capital expenditure guidance continues to rise, the valuations of cloud vendors will come under pressure ahead of the AI narrative itself. This is a verifiable judgment, with the premise being that both companies provide guidance for slowing revenue and rising expenditure in the next earnings report; looking at only one company does not count.
The risk of cloud vendors advancing funds lies on the delivery side rather than the demand side, as the minimum consumption clause leaves the demand risk to Anthropic itself. Once capacity construction is delayed, the first to be constrained will be Anthropic's revenue growth. Cloud vendors have received the money but must buy chips and power downstream; the next chapter will look at who receives cash first and who advances funds first.
3. Who Gets Paid First, Who Advances Funds First
3.1. Chip Layer: Broadcom is the most unique, TSMC benefits on both sides, NVIDIA and AMD focus on share and delivery
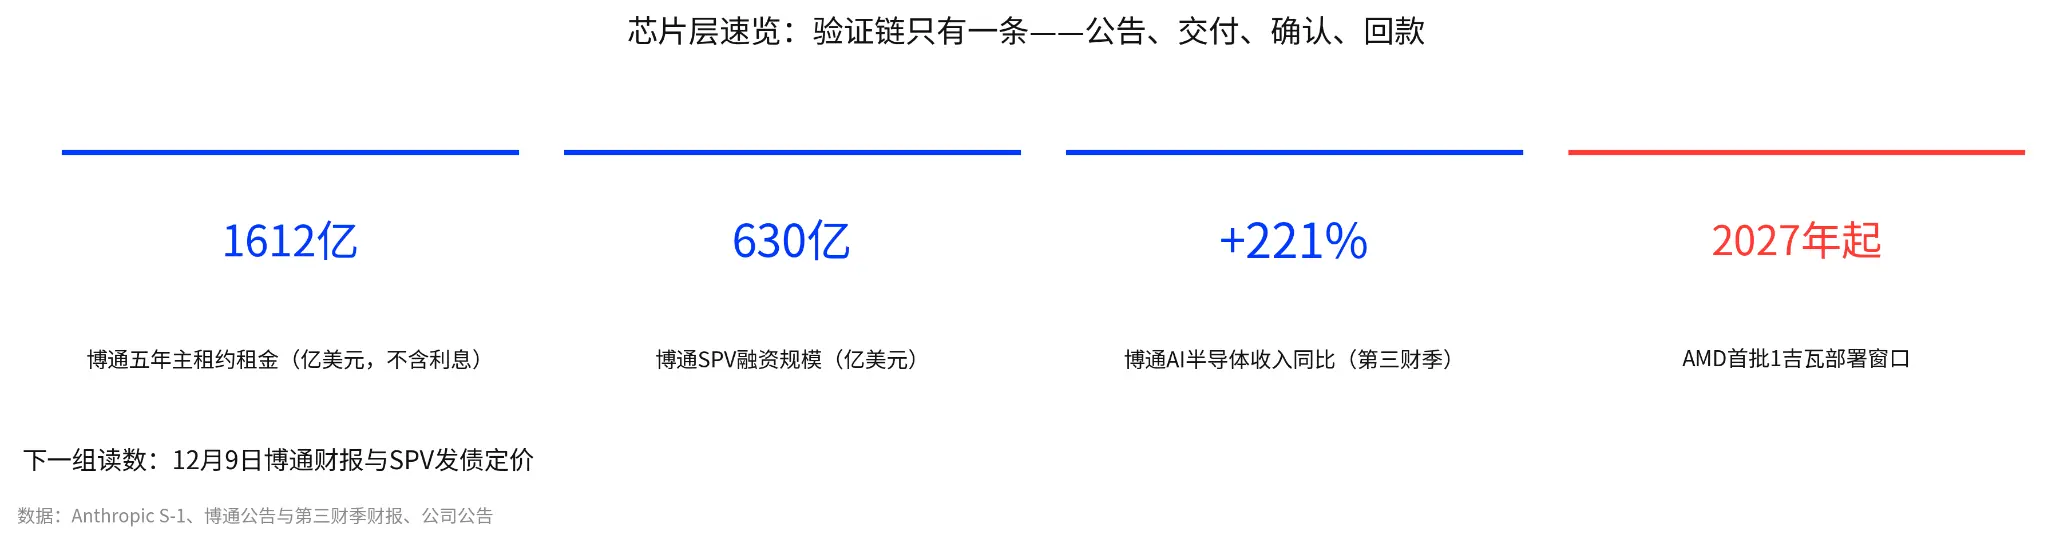
Chip layer overview: Broadcom rent is $161.2 billion, SPV financing is $63 billion, AI revenue up 221%, AMD to deliver starting in 2027.
First, look at the total table, categorized by links, to further analyze the massive spending committed by Anthropic in its S-1 to measure which suppliers can gain the most certain and largest scale of future revenue:
|------------|----------------|----------------|----------| | Link | Profit Source | Primary Risk | Associated Companies | | Custom Chips (ASIC) | Chip design and customization revenue | Customer concentration and financing risk | Broadcom | | General GPU | Chip sales, software ecosystem, and system delivery | Competitive share and real task costs | NVIDIA and AMD | | Advanced Manufacturing | Wafer manufacturing and packaging services | Expansion, depreciation, utilization, and regional risks | TSMC | | Storage | HBM and other high-bandwidth memory upgrades | Price cycles, customer self-development, and white-labeling | SK Hynix and Micron | | Interconnect | Network switching and cluster interconnect | Technological iteration and customer architecture changes | Arista |
Broadcom belongs to the custom chip and network interconnect segment, making it the most unique link in this chain: it is both a direct counterpart to Anthropic and a funding party. The five-year main lease rent is approximately $161.2 billion (excluding interest); on October 26, 2026, Broadcom established a $63 billion SPV with Bank of America, Blackstone, Citigroup, and Morgan Stanley to purchase XPU accelerators and network equipment with committed funds and lease them to Anthropic. This SPV plans to issue approximately $21 billion in bonds later. The SPV's purchase of equipment is a financing procurement arranged by Broadcom, not an independent chip demand added by end customers, with the risk falling on Broadcom and the SPV side. There is also a maximum financing limit of $4.2 billion, with a regular PIK rate of 9% and 13% under specific income conditions, with zero principal outstanding as of the end of June; this limit is used to pay existing rent and cannot be added to the rent. Broadcom's own third-quarter revenue was $29.6 billion, up 85.5% year-over-year, with AI semiconductor revenue up 221%, and free cash flow for the quarter was $13.665 billion. Looking ahead, three things matter: whether computing power can go live on time, whether revenue can be recognized as agreed, and whether cash collection can keep pace with profits. If data center delivery continues to be delayed and customers rely more on financing to pay rent, or if profit growth is accompanied by worsening cash recovery, priorities should be adjusted.
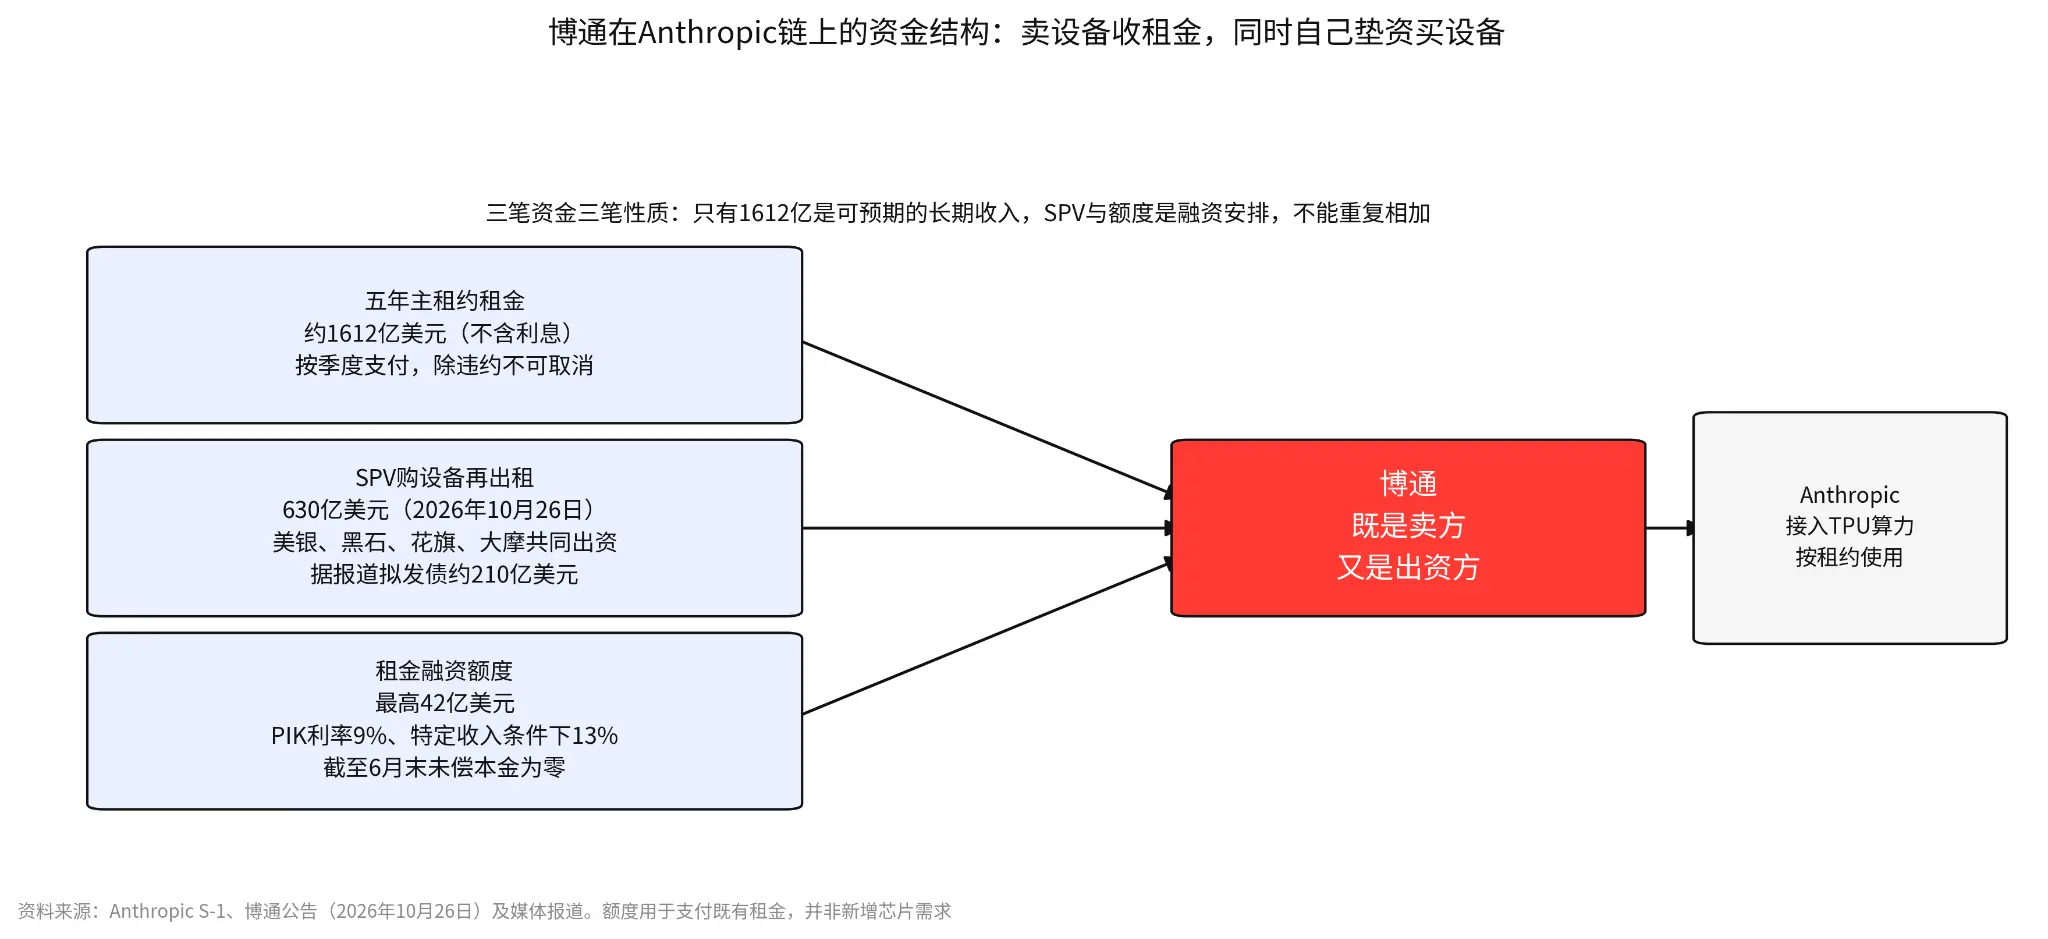
Broadcom's funding structure on the Anthropic chain: selling equipment and collecting rent while also advancing funds to buy equipment.
TSMC belongs to the advanced manufacturing segment, standing on both sides of the architecture competition: competition between GPUs and custom chips will increase the demand for advanced wafers and packaging, and cross-architecture exposure reduces reliance on a single model winner, but does not eliminate the capital cycle. The company's capital budget for 2026 is $60 billion to $64 billion, and management expects the annual capacity growth of the N2 family to more than double in 2027 (according to research cited from TSMC's third-quarter earnings meeting). It does not bet on which chip architecture will win, but expansion, depreciation, and utilization will still follow the capital cycle.
NVIDIA belongs to the general GPU segment, with verification points focused on share rather than total volume: the official cooperation announcement on November 18, 2025, involves the Grace Blackwell and Vera Rubin platforms with an initial maximum of 1 gigawatt of computing power. Customers increasing their use of TPU and AMD does not automatically equate to a decline in NVIDIA's revenue, but it may change share and pricing power.
AMD also belongs to the general GPU segment, with verification waiting until 2027: the first 1-gigawatt of the MI450 series will begin deployment in the first half of 2027, with a total planned deployment of up to 2 gigawatts, and the deployment scale is a plan rather than already delivered revenue. If the initial scale is fully procured, expenditures during the agreement period are expected to exceed $20 billion; there is also a maximum of $5 billion equity investment plan, which should not be confused with returns from core sales.
SK Hynix and Micron belong to the storage segment, which is an extension of the chip layer: this is an industry correlation, not a verified direct order from Anthropic. SK Hynix's HBM4 will be shipped in bulk in the second quarter of 2026, with long-term agreements reached with about 10 customers; Micron's HBM4 is aimed at the Vera Rubin platform, with net capital expenditures of approximately $27.37 billion for the fiscal year 2026. Long-term agreements increase visibility, but pricing, cancellation terms, and customer attribution still need verification; the low price-to-earnings ratio formed during peak profitability cannot be directly considered cheap.
Arista belongs to the network interconnection segment: Broadcom has announced Tomahawk 6, Jericho 4, and 800G network cards, while Arista has announced 1.6Tbps AI network products; the existence of products does not equate to having received orders.
Another cross-company phenomenon is worth examining separately: reports indicate that NVIDIA and AMD each invested $3 billion and $1 billion in late October to participate in Meta's stock sale. Chipmakers are binding customers with equity, and the comparability of financial statements is declining.
It is worth noting that industry correlation does not equal direct orders: the counterparties named in the S-1 are only Broadcom, AMD, NVIDIA, and TSMC; the rest are industry correlations. The more direct the relationship, the higher the likelihood of being prioritized and driven by Anthropic. In order, Broadcom and TSMC are at the forefront; NVIDIA and AMD are second, looking at share and delivery, not total volume; storage and interconnection come later, waiting to see order and revenue data.
3.2. Power Layer: The most solid orders, with the most stages to pass for cash collection
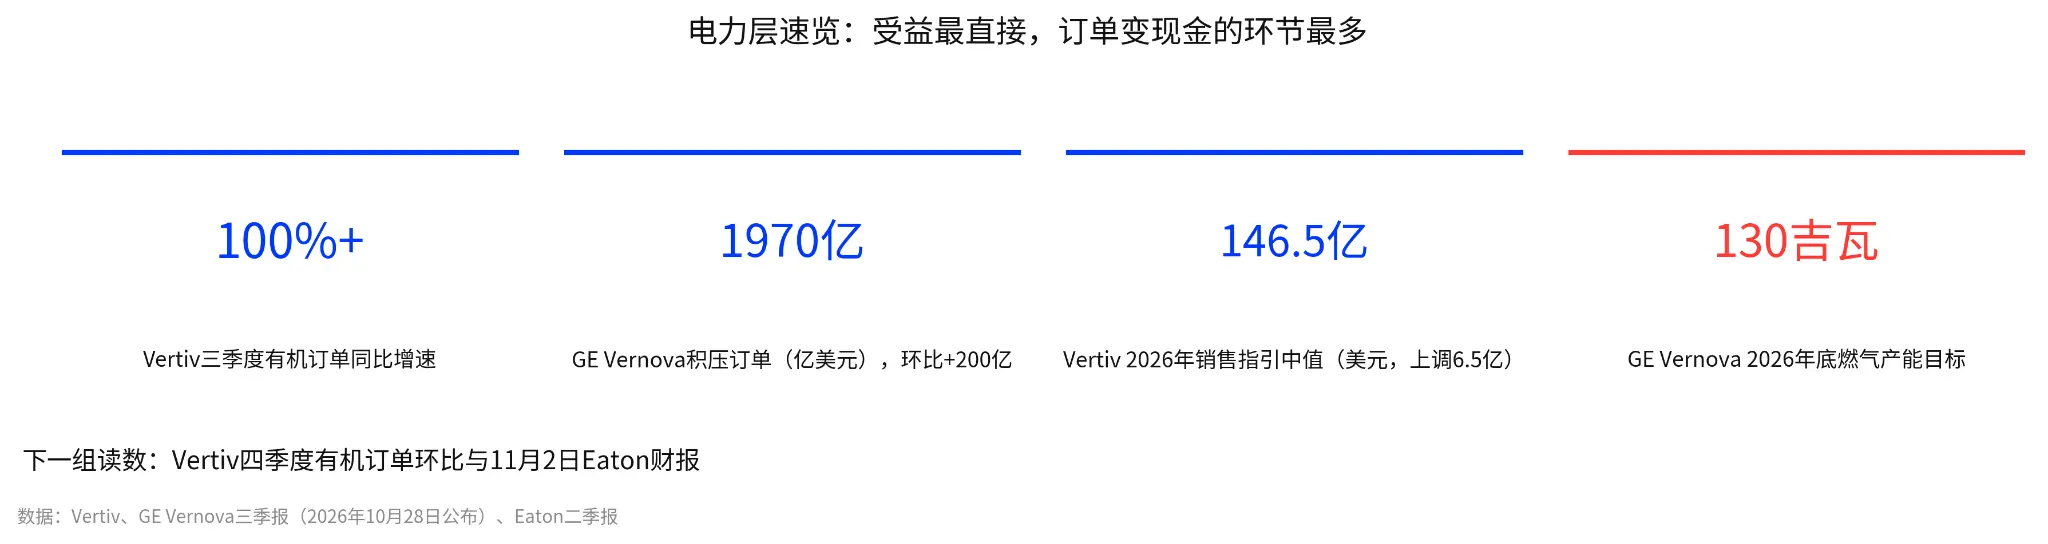
Power layer overview: Vertiv's organic order growth exceeds 100%, GEV backlog at $197 billion, guidance raised, capacity at 130 gigawatts.
Vertiv's financial report puts the heat in plain sight. On October 28, it announced its third-quarter report: revenue of $4.313 billion, a year-on-year increase of 61%; adjusted earnings per share of $2.21, adjusted operating profit margin of 25.2%; organic orders increased by over 100% year-on-year. The company also raised the midpoint of its 2026 sales guidance by $650 million to $14.65 billion, closing up 16.48% that day. Management stated that order growth indicates strong market demand, not just replenishment of previous orders. Whether this statement is accurate will depend on whether fourth-quarter orders continue to grow sequentially. 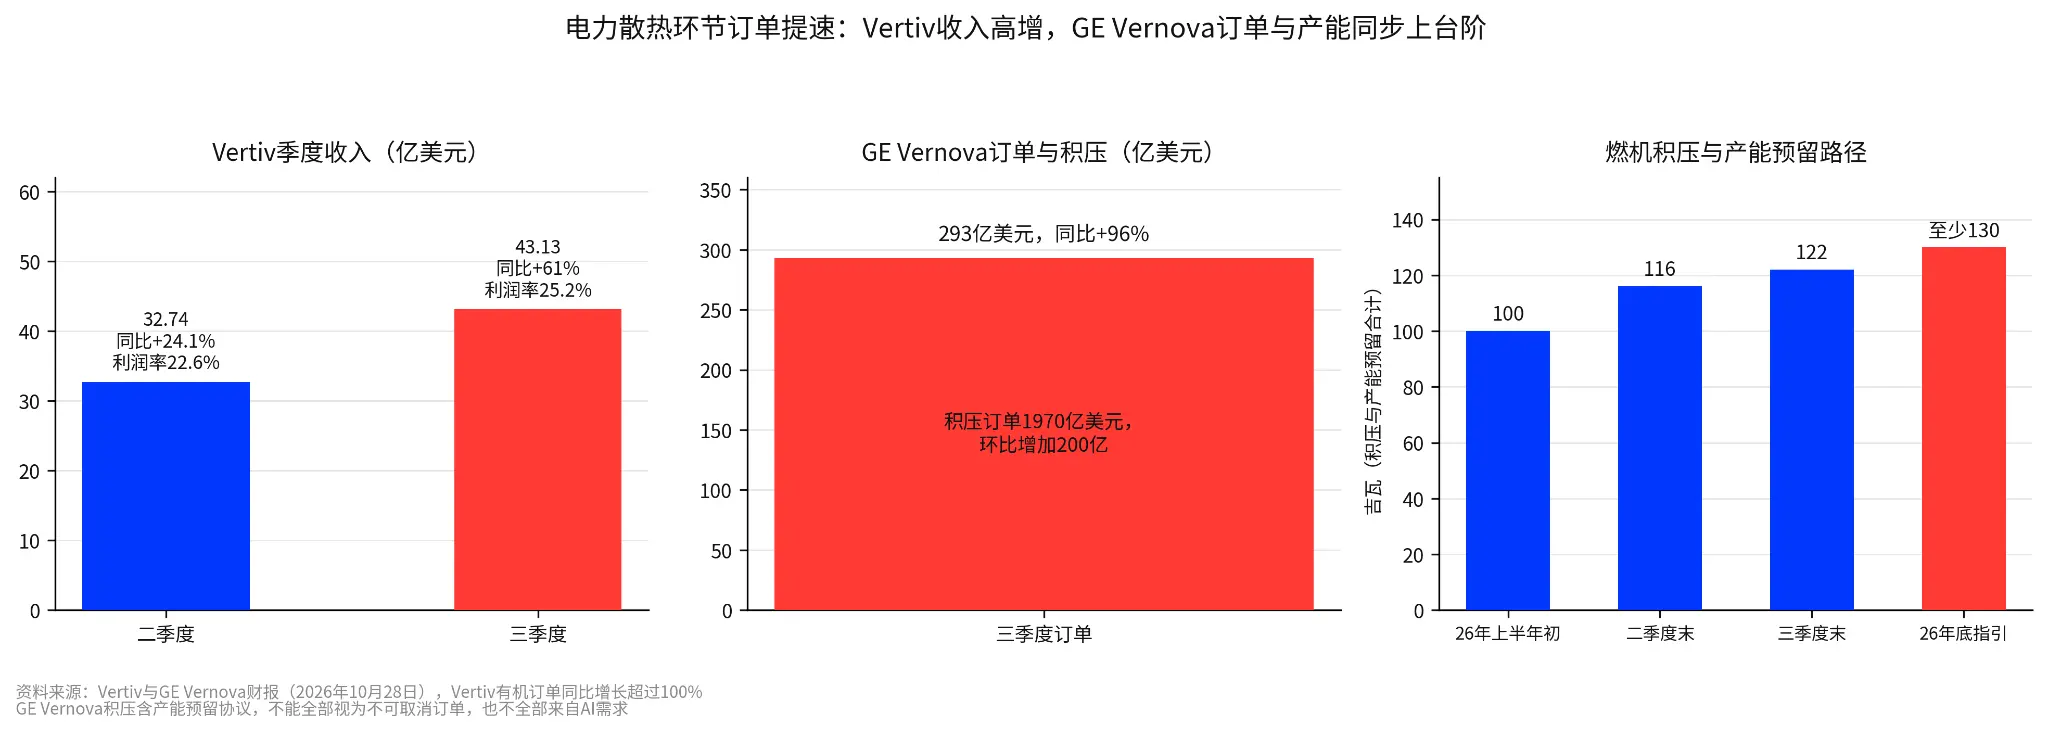
Orders in the power cooling segment are accelerating: Vertiv's revenue is growing rapidly, and GE Vernova's orders and capacity are both stepping up.
GE Vernova's third-quarter report on the same day is larger in scale, but there is a multi-year construction cycle between placing orders and receiving payments. Orders totaled $29.3 billion, a year-on-year increase of 96%, with backlog orders increasing by $20 billion to $197 billion, and gas equipment reserve agreements increasing from 116 gigawatts to 122 gigawatts, with expectations of at least 130 gigawatts by the end of 2026; cash flow guidance for 2026 was raised to $16 billion to $17 billion, and on the same day, an $8 billion acquisition of Trench Group was announced along with an increase in buyback authorization, closing down 1.90% that day. Reserve agreements are included in the total and cannot all be considered non-cancelable orders, nor can they all be attributed to AI demand.
Eaton's electrical business backlog increased by 43% year-on-year in the second quarter, and revenue from data centers in the Americas increased by about 65%, but this is overall departmental data and does not equate to AI or Anthropic orders.
The S-1 does not disclose corresponding suppliers for the power segment item by item; the aforementioned growth comes from the overall demand in data center construction. Next, we need to verify order revenue ratios, delivery cycles, segment profit margins, and working capital; if orders grow but cash conversion worsens, it indicates that demand has not yet turned into recoverable cash. The pricing power brought by equipment shortages also needs to go through approval, construction, and production before it becomes a continuous cash return.
3.3. Application Software: The money collected is not from Anthropic, but from end customers' workflow budgets
The application layer is different from the chip and power layers. It does not directly receive orders from Anthropic but rather the billing methods changed by Anthropic: the cheaper the model, the more it is billed by usage, making the billing logic of subscription software more passive. This is the reason why the software layer can stand alongside the first two layers.
Salesforce and ServiceNow have both disclosed product collaborations with Anthropic, but neither has separately listed the revenue contribution from the collaboration: product integration is just the starting point; it remains to be seen whether contracts can be converted into paid usage, renewals, and cash recovery. ServiceNow released its financial report after the market closed on October 28, reporting revenue of $4.106 billion and net profit of $277 million; the forward guidance for subscription revenue raised market concerns about the impact of AI on the subscription payment model, with the stock price dropping about 19% at one point after hours, closing at $150.13, down 3.00%. The S-1 shows that about 80% of revenue is billed by usage, which is also a source of concern: customer spending is shifting from subscription fees to usage, and the intermediate software billing may not necessarily increase.
The application layer needs to calculate the net account: new task revenue minus inference costs, delivery support costs, and then minus the profit from replaced seats. Differentiation has already appeared: Salesforce has made Claude the default model for some products, going through channels and distribution; ServiceNow has partnered with Anthropic as an Agent product design partner, embedding the agent into its workflow engine, betting on the locking power of enterprise processes. Value protection relies on unique data, complex operational permissions, business workflows, and payment relationships; the more comprehensive the capture, the smaller the space for customers to bypass or for models to erode prices. Applications that simply resell model access will face dual pressures from direct customer access and model price reductions. The demand logic for security and governance is relatively independent; CrowdStrike's group ARR is $5.84 billion, a year-on-year increase of 25%, but Agent security revenue is not separately listed, and group growth cannot all be counted as AI.
The verification cycle for the application layer is longer than for chips and power: chips look at delivery, power looks at orders, and applications look at renewals and seats; changes will only be visible in financial reports. This is also the reason for placing the application layer at the back of the research queue. ServiceNow's fourth-quarter subscription guidance and renewal performance will bring the differentiation of channel-based and workflow-based routes to the forefront.
On the entire chain, the first to receive cash is Broadcom, with free cash flow of $13.665 billion for the quarter; the slowest cash collection is in the power layer, where orders must pass approval, construction, and production before turning into cash; application software guards its own workflow budget. If the cancellation window for SpaceXAI is triggered in early 2027, the first to be reassessed will be the visibility premium based on these orders. Whether this money can ultimately return to each company's financial statements depends on how the contract terms are written. The next chapter will return to Anthropic's own billing and contracts to see where the risks lie.
Four, Verification Nodes for the Next Nine Months
There don't need to be many nodes; each node should correspond to a hypothesis that can be overturned. The table below arranges the verification nodes for the next nine months into a schedule, with each row answering five questions: when to look, what event to observe, what the verification reading is, what signal appears to overturn the judgment, and which layer or aspect of the chain is affected.
|------------|---------------------|------------------------------|---------------|---------| | Time Point | Event | Verification Reading | Contradictory Signal | Affected Layer | | November 2 | Eaton and Palantir Financial Reports | Eaton electrical business backlog growth rate and data center revenue growth rate | Significant decline in departmental backlog growth | Power Layer | | November 3 | AMD Third Quarter Report | Helios rack-level system delivery rhythm and Instinct gross margin statement | Delivery delays or reliance on low prices to gain market share | Chip Layer | | November 17 | NVIDIA Financial Report | Data center revenue and statements regarding large customer self-research | Confirmation of large customer diversion signals by management | Chip Layer | | December 9 | Broadcom Fourth Quarter | AI chip revenue compared to guidance of about $21.7 billion, SPV bond issuance progress | Guidance not met or bond issuance delayed | Chip Layer and Financing Side | | From December | Expected start of SpaceXAI full-load delivery | Announcement of received and billed computing power | Noticeable delay in delivery rhythm | Contract Aspect | | Undetermined Time | S-1 revised draft or first 10-Q after listing | Annual breakdown of $265.6 billion commitments and updates on customer concentration | Delays in disclosure of breakdown | Reporting and Contract Aspect | | January and March 2027 | Initial non-cancelable period for SpaceXAI expires | Actual usage of signed computing power | Any party issues a cancellation notice | Contract Aspect | | By the end of January 2027 | Google and Microsoft Financial Reports | Whether cloud revenue growth direction aligns with capital expenditure guidance | Revenue slows while expenditure rises | Cloud Layer and Valuation | | First half of 2027 | AMD's first batch of 1 gigawatt deployment | Deployment progress, software migration, and performance-to-price ratio | Plans remain on paper | Chip Layer |
Data source: Company financial report schedules, Anthropic S-1, and media reports; Broadcom guidance is based on reports.
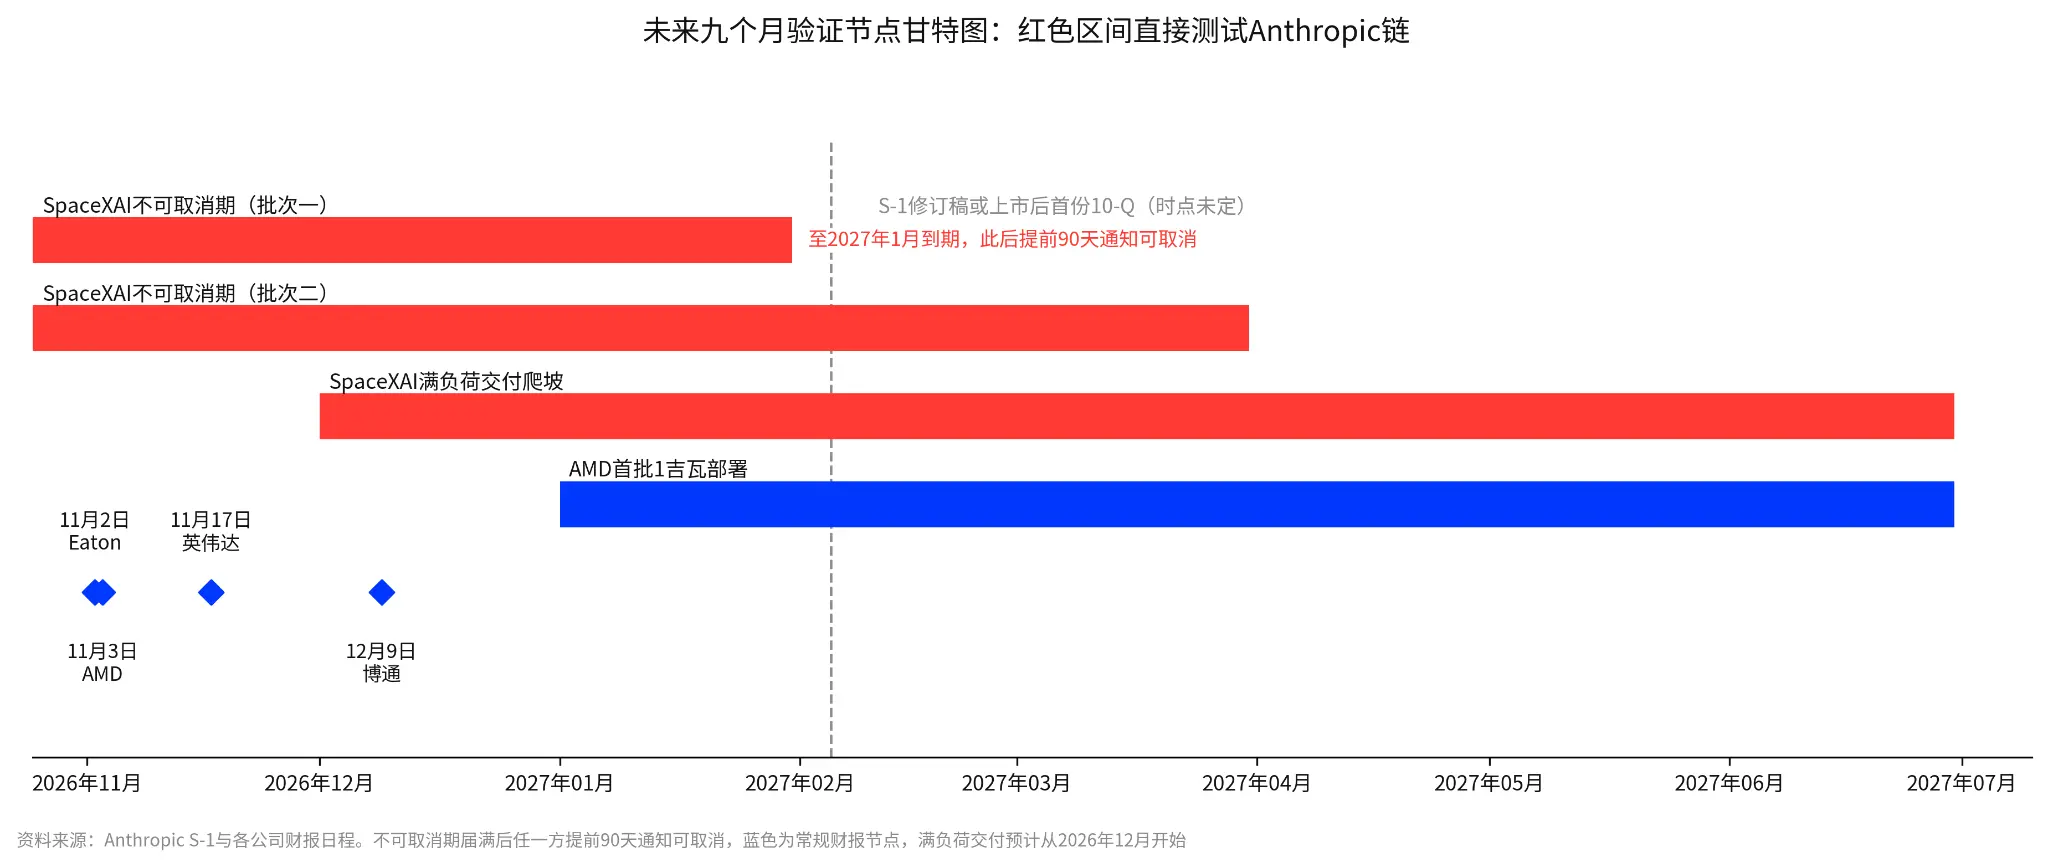
Gantt chart of verification nodes for the next nine months: The red intervals directly test the fulfillment of commitments in the Anthropic chain.
Corresponding to the targets, the tracking list is as follows, with reasons for selection and exclusion detailed in each chapter of the main text.
|-----------------------------------|--------------------|-------------------|--------------| | Underlying Asset | Why it's on the list | Next set of readings | Contradictory signals | | Broadcom | Anthropic's direct competitor and investor | December 9th fourth quarter and SPV bond pricing | Delivery delays or bond cancellations | | TSMC | Revenue from both GPU and custom chips | 2027 N2 capacity and utilization guidance | Repeat bookings or customer delays | | Vertiv | Power cooling orders validated | Organic orders quarter-over-quarter | Quarter-over-quarter turn negative or design switches | | GE Vernova | Gas turbine backlog and capacity reservation | At least 130 gigawatts to be realized by year-end | Guidance downgrade or reservation cancellations | | Eaton | Data center electrical backlog | November 2nd financial report | Backlog growth rate declines | | NVIDIA and AMD | Share and delivery validation | November 17th and November 3rd financial reports | Self-developed diversion or delivery delays | | ServiceNow, Salesforce, CrowdStrike | Application layer revenue attribution | Fourth quarter subscription guidance and renewals | New customer acquisition impacted, leading to weaker renewals |
Data Source: Summary of verification items from each chapter of the main text. The list is a tracking priority, not a buy rating.
Conclusion: From Narrative Pricing to Cash Pricing
This S-1 has shifted the pricing basis of the AI industry chain from "narrative" to "contracts and cash flow." The market is repricing according to validation order: Vertiv up 25% (orders validated), NVIDIA only up 2% (share diverted). The two hardest nodes in the next nine months are the January 2027 SpaceXAI cancellation window and the December 9th Broadcom financial report and SPV bond pricing. Before these two nodes, the priority of the tracking list is Broadcom, TSMC, Vertiv, and cloud vendors: Broadcom is both a seller and an investor, and its payment rhythm is the most sensitive thermometer for the entire chain. TSMC is earning revenue from two chip routes simultaneously. Vertiv's orders have been validated by financial reports. The answers from cloud vendors will wait until the financial reports at the end of January next year. Before that, contract terms are more important than stories, and payment speed is more important than total order amounts. If the S-1 revision does not split the $265.6 billion commitment for annual payments, or if SpaceXAI experiences cancellations in early 2027, the visibility premium of orders for cloud vendors and chip manufacturers needs to be adjusted downward.
Disclaimer: The content of this article is for general information and market commentary purposes only, compiled based on publicly available information as of the time mentioned in the text. Relevant market data, expectations, and probabilities may change with market conditions. The views and investment strategies cited from third-party institutions, analysts, or other individuals represent the views of the relevant third parties at a specific time and do not represent the views or recommendations of BIT. This article does not constitute investment advice, investment research, solicitation, or a recommendation for any securities, investment products, or trading strategies, nor should it be the basis for any investment decisions. Financial markets carry risks, and securities prices and market performance may fluctuate; past performance and historical market trends do not represent or guarantee future results. Investors should independently assess the relevant risks based on their own circumstances and seek professional advice when necessary. BIT's Hong Kong stock trading services are not provided to Hong Kong residents or users in other restricted jurisdictions.
 Risk warning Risk warning




Popular articles