BTC $79,417.03 -0.68%
ETH $2,490.69 -0.48%
BNB $744.20 -1.83%
XRP $1.40 -1.55%
SOL $104.86 -1.55%
TRX $0.3363 +0.35%
DOGE $0.0897 -0.34%
ADA $0.2197 -0.72%
BCH $256.07 -1.86%
LINK $13.18 +7.27%
HYPE $87.64 -0.77%
AAVE $133.66 -1.48%
SUI $0.8124 +1.53%
XLM $0.1911 +2.16%
ZEC $1,195.19 +0.73%
BTC $79,417.03 -0.68%
ETH $2,490.69 -0.48%
BNB $744.20 -1.83%
XRP $1.40 -1.55%
SOL $104.86 -1.55%
TRX $0.3363 +0.35%
DOGE $0.0897 -0.34%
ADA $0.2197 -0.72%
BCH $256.07 -1.86%
LINK $13.18 +7.27%
HYPE $87.64 -0.77%
AAVE $133.66 -1.48%
SUI $0.8124 +1.53%
XLM $0.1911 +2.16%
ZEC $1,195.19 +0.73%

concentration

All
Article
Flash

hot_img In the first half of the year, cryptocurrency TradFi transactions exceeded $1.3 trillion, with the exchange landscape shifting from a unipolar concentration to a multipolar distribution

According to a research report published by RootData Research, the total trading volume of mainstream cryptocurrency exchanges in the TradFi sector surpassed $1.3 trillion in the first half of 2026, nearly a tenfold increase compared to the entire year of 2025, with TradFi derivatives accounting for over 98%, becoming the core engine driving the explosive growth of the sector.The exchange landscape is shifting from "unipolar concentration" to multipolar competition. Binance, while maintaining a leading position in the TradFi sector with a cumulative share of 68.3%, saw its monthly trading volume share decline from 78.8% at the beginning of the year to 58.2% in August. Meanwhile, second-tier exchanges such as OKX, Gate, and Hyperliquid are rapidly expanding, with market shares of 18.2%, 10.7%, and 9.9% respectively in August.In the core submarket of stock derivatives, entering August, Binance still dominated with an average daily trading volume of $14.927 billion; OKX established an advantage in trading costs with the industry's lowest spread of 0.0091%, achieving a comprehensive score tied for second with Gate. Gate has recently shown independent growth, recording four consecutive months of triple-digit month-on-month growth from May to August, and in mid-August, its ±2% weighted depth ranked first in the industry for 11 consecutive trading days. The competitive logic of the TradFi sector may be shifting from a battle for traffic to a competition across comprehensive dimensions such as position size, market depth, trading costs, and variety coverage.

Report: The concentration of the DeFi treasury market is significant, with the top 5 managers controlling 69% of the funds

Vaults.fyi released the report "2026 DeFi Custody Market Status," covering 856 vaults, 131 custodians, and 18 protocols, with a total locked value of approximately $11.29 billion. Over the past year, the TVL on the supply side of DeFi decreased by 41.8%, while the TVL of custody vaults grew by 39%, increasing market share from 5.24% to 12.51%. The top 5 custodians manage 69% of the funds, and the top 10 account for 79.1%. The leading landscape has changed dramatically, with Sentora and Concrete not making the list a year ago, now ranking second and fourth, respectively, while Usual dropped from fourth to thirty-fourth.Morpho ranks first among protocols with a custody TVL of 46.2%, with the remaining 53.8% distributed across the other 17 protocols. Bitcoin collateral accounts for 54.1% of Morpho's top 25 stablecoin vaults (approximately $3.71 billion). In terms of address concentration, weighted by TVL, a single address holds an average of 47% of vault shares, with the top ten addresses collectively controlling 74%. About 33% of the custody funds require a multi-step redemption process, with a 7-day annualized yield median of 4.82%, which is 98 basis points higher than instant redemption vaults.The report also points out that traditional financial institutions such as Société Générale, Apollo, and JPMorgan have begun to deploy custody vault strategies.

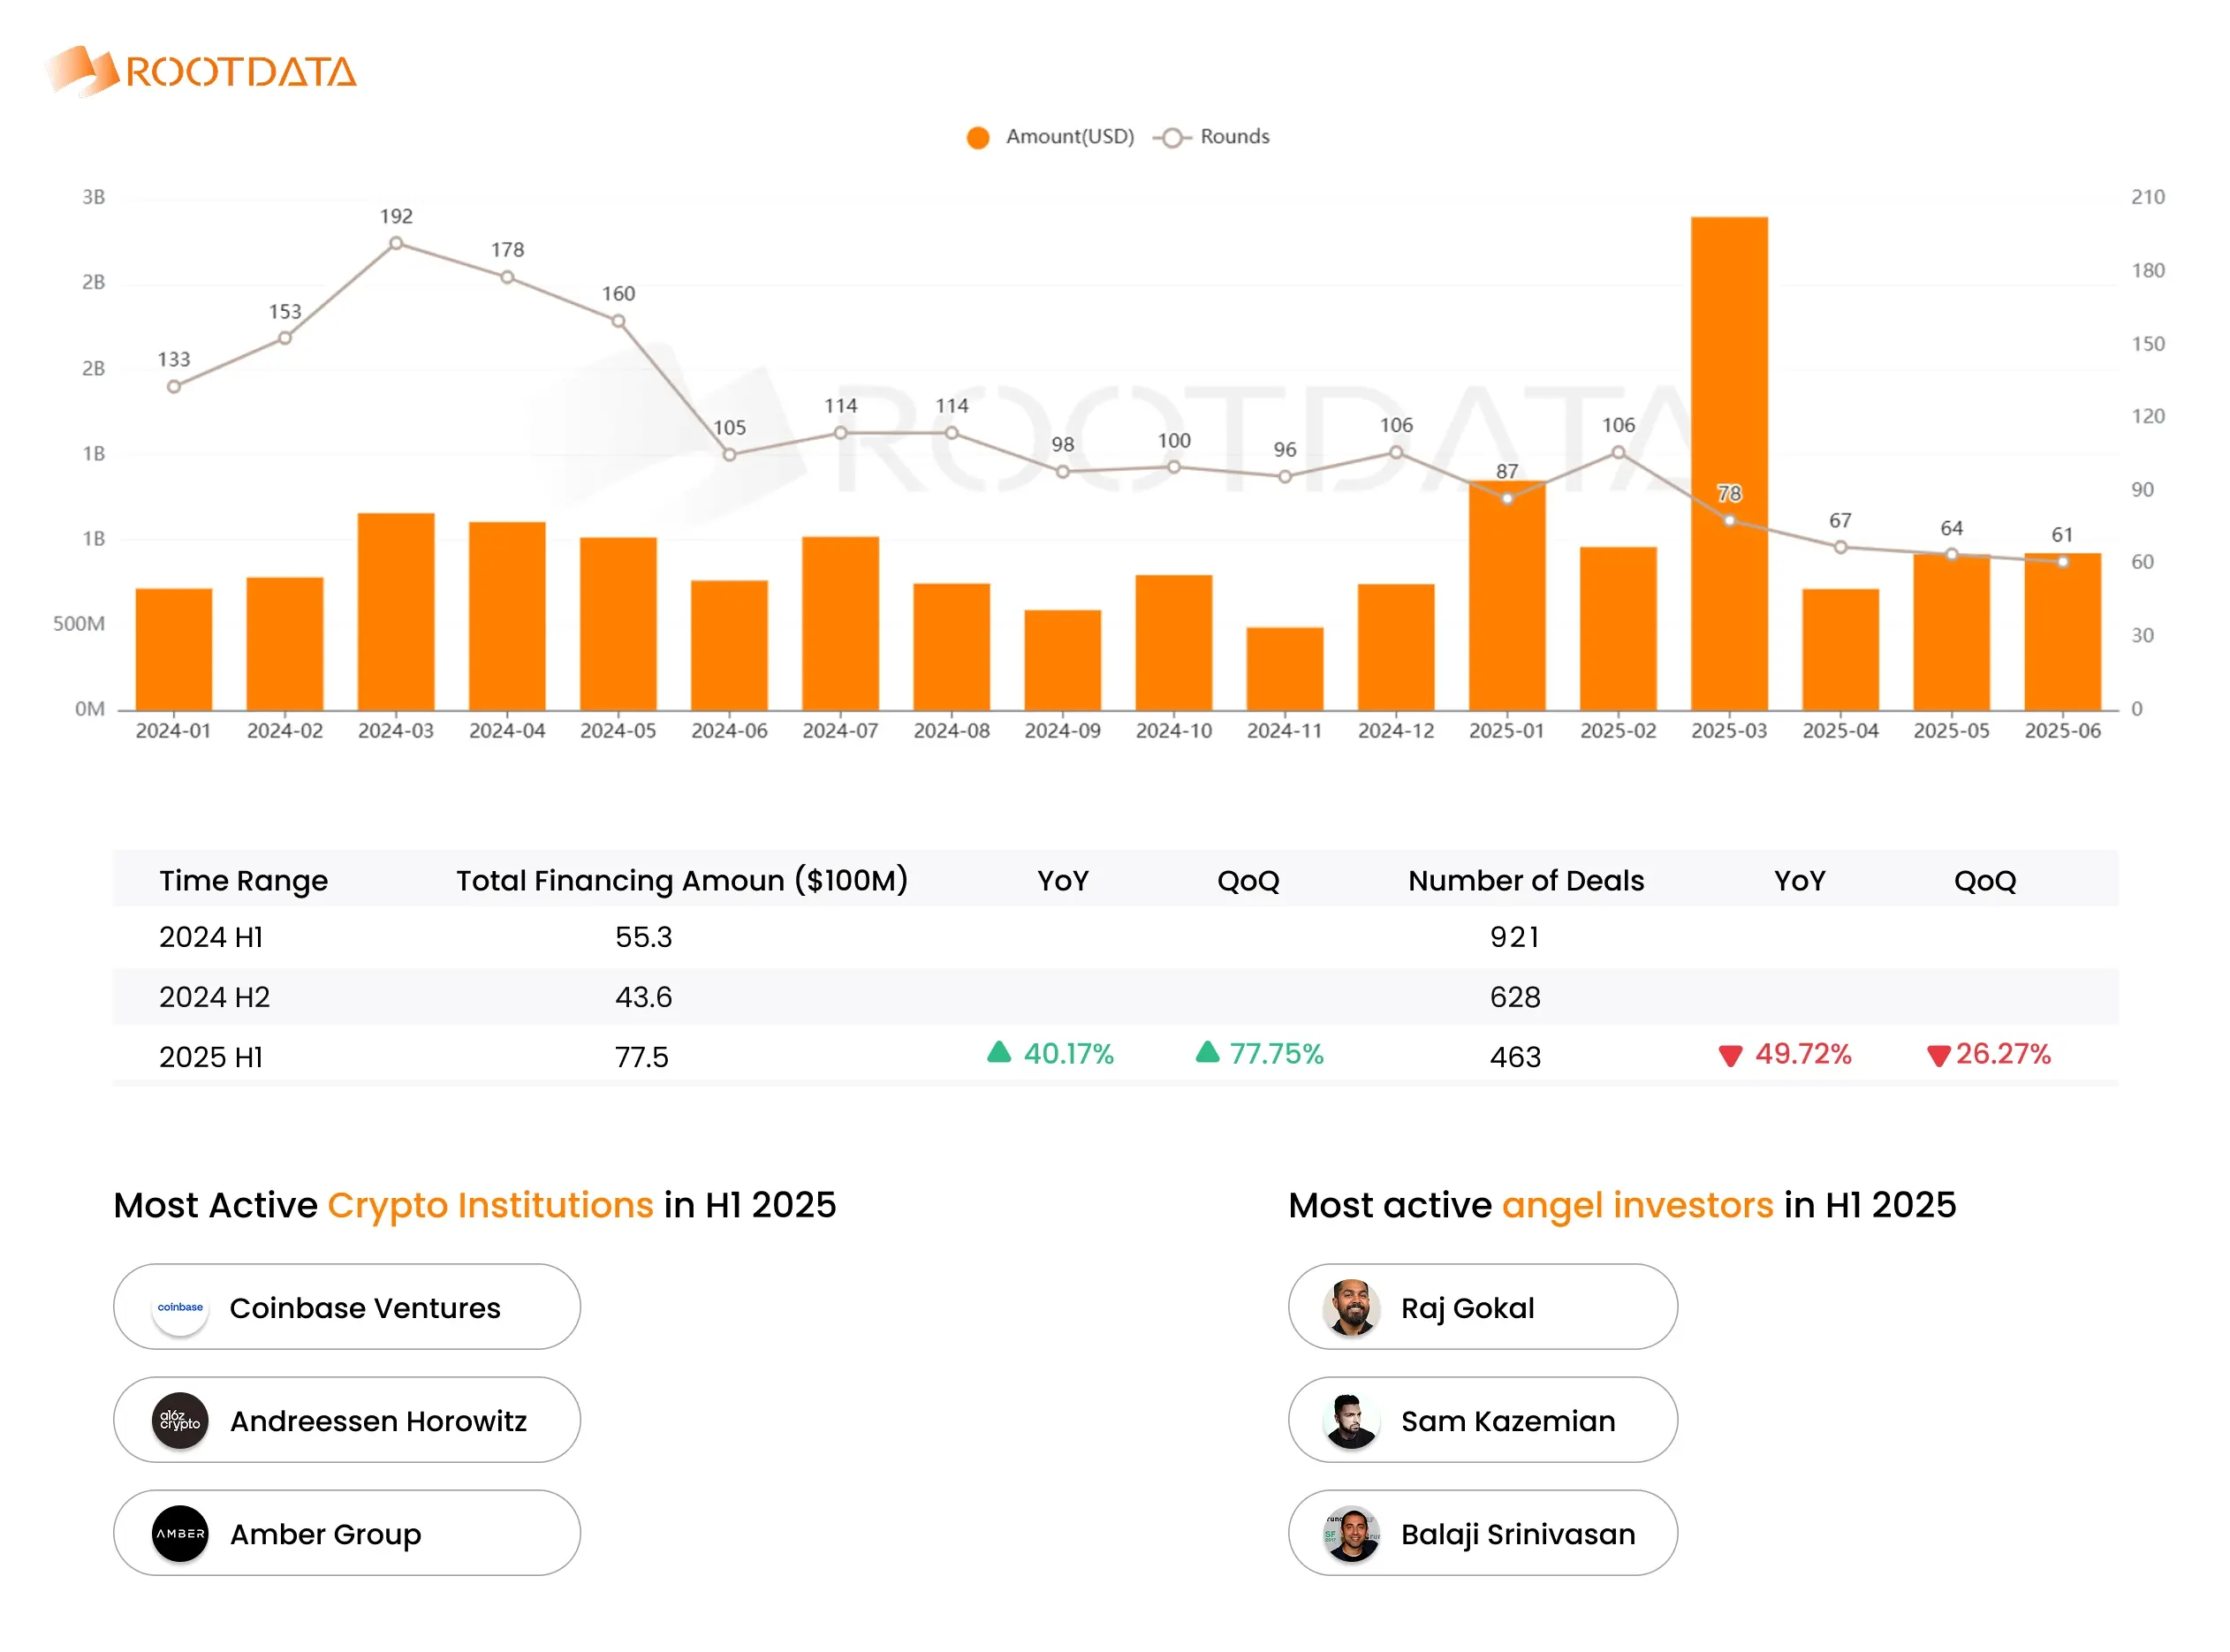
hot_img RootData: The total financing amount in the first half of 2025 is 7.75 billion USD, showing characteristics such as a shift in preference for large-scale financing concentration in specific sectors

ChainCatcher news, according to statistics from the Web3 asset data platform RootData, the crypto primary financing market completed a total financing amount of $7.75 billion in the first half of 2025, an increase of 40.17% year-on-year and 77.75% quarter-on-quarter. In March alone, $2.895 billion was raised, with Binance completing $2 billion in financing. If we exclude the impact of this financing, the average monthly financing amount in the first half of the year remained around $950 million, with an average financing amount of $12.419 million and a median of $5.425 million.In terms of the number of financing events, there were a total of 463 financing events in the first half of the year, averaging 77 events per month, a decrease of 49.72% year-on-year and 26.27% quarter-on-quarter. In the financing track, CeFi led with $2.719 billion, surpassing the previously popular infrastructure track ($1.87 billion).It is noteworthy that merger and acquisition events reached 66, an increase of 60.9% compared to the 41 events in the second half of 2024. Additionally, crypto-related publicly listed companies like Circle and Sol Strategies raised a total of $2.233 billion. Both types of financing data set historical records.The most active institutions in the first half of the year were Coinbase Ventures, a16z, and Amber Group, each participating more than 20 times. Following them were institutions such as Animoca Brands, GSR, Selini Capital, 1kx, and Mirana Ventures. The most active angel investors were Raj Gokal, Sam Kazemian, and Balaji Srinivasan.Overall, the financing amount in the crypto primary financing market significantly increased in the first half of 2025, but the number of events continued to decline compared to previous years, showing characteristics such as the concentration of large financings, increased M&A activities, and changes in track preferences, while more funds began to shift towards the more liquid secondary stock market.
RootData: The total financing amount in the first half of 2025 is 7.75 billion USD, showing characteristics such as a shift in preference for large-scale financing concentration in specific sectors
app_icon
ChainCatcher Building the Web3 world with innovations.