SignalPlus Volatility Column (20240531): Month-End Wrap-Up, IV Decline

 In terms of digital currency, on the last day of this month, BTC and ETH closed at 68201.52 (+0.62%) / 3731.97 (0.12%).

Yesterday (30 MAY), the cooling of U.S. economic data renewed market confidence in interest rate cuts, with the actual GDP annualized revision down to 1.3% (previous value was 1.6%), marking a new low since the first quarter of 2023. Both inflation data and consumer spending slightly decreased, while the existing home sales index saw a significant unexpected drop of -7.7%, the lowest since February 2021. After the data was released, U.S. Treasury bonds retraced all gains from the previous day, with the current two-year/ten-year rates at 4.948% / 4.561%.

Source: SignalPlus, Economic Calendar

Source: Investing
In terms of digital currencies, as the last trading day of the month, BTC and ETH closed at 68201.52 (+0.62%) / 3731.97 (0.12%). Looking back at yesterday's market, the release of U.S. economic data boosted the prices of cryptocurrencies, pushing BTC to briefly break through the $69,000 mark, but the price quickly faced a pullback, falling back to just above $68,000. From recent trends, $69,000 seems to have shifted from a support level to a key resistance level.

Source: TradingView
In the options market, implied volatility has significantly steepened downwards, with BTC's front end dropping again by about 4-5%, and the ATM IV within one month has returned to below 50%. ETH's IV is also generally declining, but remains more than 10% higher than BTC across various maturities. The approval date for the ETF S-1 is still unknown, and the market generally believes it will not pass until at least July. The trading activity of ETH over the past 24 hours reflects a noticeable trend, characterized by a large number of bullish options positions being established in mid to late July and bearish sell-offs represented by 3000-P at the end of the month.

Source: Deribit (as of 2 MAY 16:00 UTC+8)

Source: SignalPlus, implied volatility continues to decrease


Data Source: Deribit, overall distribution of ETH trading

Data Source: Deribit, overall distribution of BTC trading

Source: Deribit Block Trade
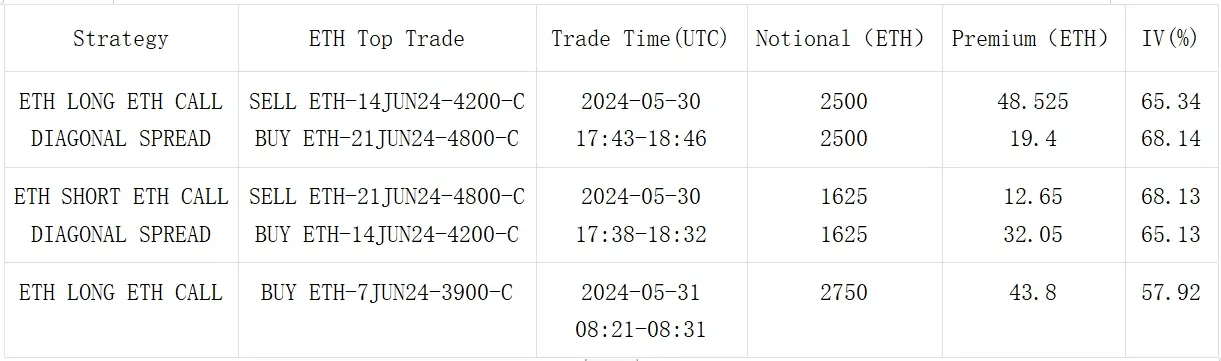
Source: Deribit Block Trade

 Risk warning Risk warning