Scan to download
BTC $70,772.33 +0.47%
ETH $2,155.17 +0.79%
BNB $643.02 +0.16%
XRP $1.42 -4.56%
SOL $81.67 -4.53%
TRX $0.2795 -0.47%
DOGE $0.0974 -3.83%
ADA $0.2735 -4.22%
BCH $471.40 +1.90%
LINK $8.64 -2.97%
HYPE $28.98 -1.81%
AAVE $122.61 -3.42%
SUI $0.9695 -0.42%
XLM $0.1605 -4.62%
ZEC $260.31 -8.86%
BTC $70,772.33 +0.47%
ETH $2,155.17 +0.79%
BNB $643.02 +0.16%
XRP $1.42 -4.56%
SOL $81.67 -4.53%
TRX $0.2795 -0.47%
DOGE $0.0974 -3.83%
ADA $0.2735 -4.22%
BCH $471.40 +1.90%
LINK $8.64 -2.97%
HYPE $28.98 -1.81%
AAVE $122.61 -3.42%
SUI $0.9695 -0.42%
XLM $0.1605 -4.62%
ZEC $260.31 -8.86%

mvrv

Analyst: Bitcoin indicators suggest that the current phase is more likely a bull market pause rather than the end of the cycle

ChainCatcher news, CryptoQuant analyst Axel posted on social media that the current annualized adjusted MVRV ratio of Bitcoin has reached the 1 range------this means that the short-term average (30 days) is basically on par with the annual average (365 days).The annualized basis remains positive, and its curve is horizontal, resulting from the mutual offset of two forces: after a strong rise, the 30-day indicator cools down in sync with volatility and profit-taking speed, while the heavy 365-day average still contains the growth momentum of the past few months. The result is that the numerator and denominator move almost in sync, with the difference between them shrinking, and the basis line neither declines nor accelerates upward------the market is substantively digesting the previous gains.This situation leans more towards a pause in a bullish structure rather than the end of a cycle. As long as the annualized basis does not show a downward reversal, the current situation should be viewed as a balanced state rather than a trend breakdown: the network is reallocating risk from impatient holders to more patient ones, and there are no signs of panic selling.The market's reaction to the current position in the coming weeks will be crucial. At this stage, what the market needs more is time rather than a reversal in direction.

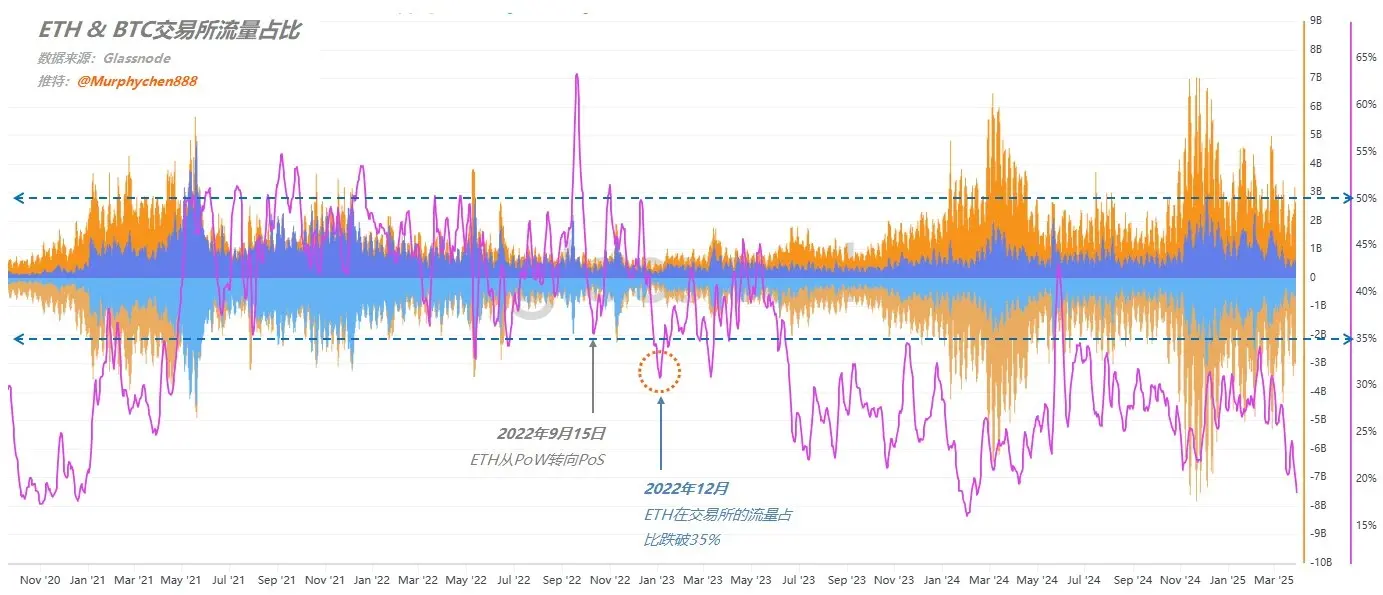
Analyst: Ethereum MVRV has shown a divergence since the end of 2022, with a key turning point being the transition to PoS

ChainCatcher message, on-chain data analyst Murphy released an analysis of ETH based on token flow and value ratio. The flow ratio of ETH on trading platforms has dropped below 35% since the end of December 2022, a figure that had exceeded 50% in September 2021. This indicates that ETH was once able to compete with BTC in terms of inflow/outflow ratios on trading platforms, but the significant decline now means that the attention of funds towards ETH is decreasing.Since December 2022, Bitcoin's MVRV "Market Value to Realized Value Ratio" (blue line) has shown a clear divergence from Ethereum's MVRV (yellow line). For the previous 7 years, this indicator had always alternated dominance, with ETH sometimes stronger and sometimes BTC stronger. Now, the blue line remains below the yellow line, indicating that since December 2022 until today, the unrealized profits of ETH holders have consistently been lower than those of BTC. Whether from trading platform data or on-chain data, the turning point for Ethereum's trend seems to have occurred in December 2022. Coincidentally, on September 15, 2022, the Ethereum mainnet merged with the Beacon Chain, completely ending PoW mining and transitioning to a PoS consensus mechanism, and everything changed right after that.As the trend of diminishing sentiment weakens, the capital inflow into these two major assets, BTC and ETH, has significantly decreased since last December. Nevertheless, BTC can still maintain a positive inflow of $5.4 billion over the past 30 days; whereas ETH has turned into a net capital outflow since February 15, with nearly $6.2 billion flowing out in the last 30 days as of yesterday. The attitude of funds is a crucial factor in determining price and trend, and ETH's revival in trend requires waiting for a renewed focus of capital.
app_icon
ChainCatcher Building the Web3 world with innovations.