BTC $78,920.02 -0.08%
ETH $2,474.76 -1.26%
BNB $691.59 -1.24%
XRP $1.39 -2.16%
SOL $103.66 -2.24%
TRX $0.3333 -2.16%
DOGE $0.0833 -2.87%
ADA $0.1978 -3.31%
BCH $248.07 -1.92%
LINK $11.39 -2.10%
HYPE $84.10 +1.17%
AAVE $123.70 -3.75%
SUI $0.7288 -3.61%
XLM $0.1787 -1.32%
ZEC $849.07 -2.73%
BTC $78,920.02 -0.08%
ETH $2,474.76 -1.26%
BNB $691.59 -1.24%
XRP $1.39 -2.16%
SOL $103.66 -2.24%
TRX $0.3333 -2.16%
DOGE $0.0833 -2.87%
ADA $0.1978 -3.31%
BCH $248.07 -1.92%
LINK $11.39 -2.10%
HYPE $84.10 +1.17%
AAVE $123.70 -3.75%
SUI $0.7288 -3.61%
XLM $0.1787 -1.32%
ZEC $849.07 -2.73%

oversold

All
Article
Flash

first_img Fairlead Strategies: Bitcoin is no longer oversold, a breakout is imminent

Fairlead Strategies Managing Partner Katie Stockton stated that Bitcoin is no longer in an oversold state, but it has not yet reached an overbought state. She pointed out that Bitcoin broke through the 200-day moving average in May, and a potential breakout may be imminent. Last week, Bitcoin began to rise due to news that the U.S. Treasury would at least double the scale of liquidity support repurchase operations, with a 7-day increase of over 22%, and the latest trading price is around $78,915, having previously surpassed $81,000 on Monday.For most of June and July, Bitcoin traded below $65,000 and experienced the lowest volatility in 17 years. Analysts believe that the so-called "devaluation trade" may heat up again, where investors buy assets when they believe fiat currencies are devaluing. The dollar declined after the Treasury's announcement, while gold and Bitcoin rose accordingly. U.S. investors re-entered Bitcoin ETFs last week, with inflows nearing $2 billion.Additionally, President Trump met with crypto executives at the White House last week, stating that pushing the Clarity Act through would keep the U.S. ahead. The bill was originally scheduled for a vote in August but has now been postponed to September, and it will establish a framework for distinguishing between securities, commodities, and payment stablecoins in digital assets.

JPMorgan: Semiconductors are nearing oversold levels, recommend gradual positioning in the summer

According to ChaoXiang Research, Morgan Stanley's stock strategy report on July 20 pointed out that AI-related stocks have faced fierce selling in recent weeks, with the South Korean stock market dropping 25% from its peak, and the Philadelphia Semiconductor Index falling 20%. Individual stocks like Samsung and Micron have seen declines between 20% and 50%. The report believes that the core driving force behind this round of decline is technical factors and position clearing, with no deterioration in fundamentals. The gap between relative prices and relative earnings trends in semiconductors continues to widen, but the supply-demand tight balance for DRAM and NAND is expected to last until 2028. DRAM spot prices remain high, and Micron has also raised its performance guidance, indicating that supply-demand tightness will last at least until 2027. The RSI of the Philadelphia Semiconductor Index is nearing the oversold zone, and the accumulated momentum gains for the year have basically been retraced.Morgan Stanley believes that once the oversold signal is confirmed, a rebound window will open, and it suggests that investors gradually position themselves in semiconductors during the summer. The proportion of second-quarter earnings reports exceeding expectations reached 97%, and companies in the S&P 500 that reported better-than-expected earnings outperformed the market by an average of 1.7 percentage points on the day of the report. In terms of allocation, Morgan Stanley has raised its equity allocation from 60% to 65%, increased its Eurozone allocation from 8.7% to 11%, and is overweight in sectors such as semiconductors, mining, capital goods, automotive, insurance, and banking, while underweighting software, business services, and media in the "AI erosion group." Regarding geopolitical conflicts, the report believes that the "buying on dips" strategy since the end of March remains effective.

Raoul Pal: Global liquidity is highly correlated with BTC, and the market is historically oversold

Raoul Pal posted on the X platform that, despite the frustration surrounding cryptocurrencies and the purely technical analysts believing the market has ended, he disagrees. Global liquidity is the most important macro factor in history, with a correlation of 90% with BTC since 2012 and a correlation of 97% with NDX. Its annual growth rate is about 10%, with no signs of slowing down.GMI's financial condition leads global liquidity by about 6 months and remains accommodative. Overall liquidity in the U.S. has been suppressed during the standstill, becoming a bearish range. This indicator leads cryptocurrencies by about 3 months and has begun to accelerate since the low point three months ago. The business cycle is a key driver of earnings and risk, showing an accelerating trend.eSLR is the mechanism by which banks enhance liquidity through credit and absorbing government bond issuance. This liquidity is also on the rise and will further accelerate. Tax refunds entering bank balance sheets enhance the tendency for credit creation, thereby increasing liquidity. The U.S. will further cut interest rates, increasing disposable income and thereby raising risk appetite.The CLARITY Act is expected to pass, driving funds into the market. Many banks and asset management firms are eager to use this technology, and this act will address that. Stablecoins are accelerating in development, with issuance increasing by 50% last year and still accelerating. Trading volumes have reached trillions of dollars and continue to rise.The U.S. government's support for cryptocurrencies has reached an all-time high. Eventually, agencies will be put in place, greatly accelerating market development and creating a whole new total addressable market. The crypto market remains in a state of panic, with most indicators showing it is at one of the most oversold stages in history.The weekly DeMark indicator will provide very solid support in two weeks (this indicator is now available on Trading View). The daily DeMark indicator is also in an overlapping state. Any weakness that appears will complete the daily and weekly indicators, indicating the potential for a full trend reversal. The risk factor lies in how long oil prices remain high. The next two weeks are a key focus period. He believes the aforementioned factors will yield positive results, with expectations for further upward movement.

BTC OG insider whale agent: Bitcoin, ETH, and Nasdaq ratio hit bottom, RSI indicator severely oversold

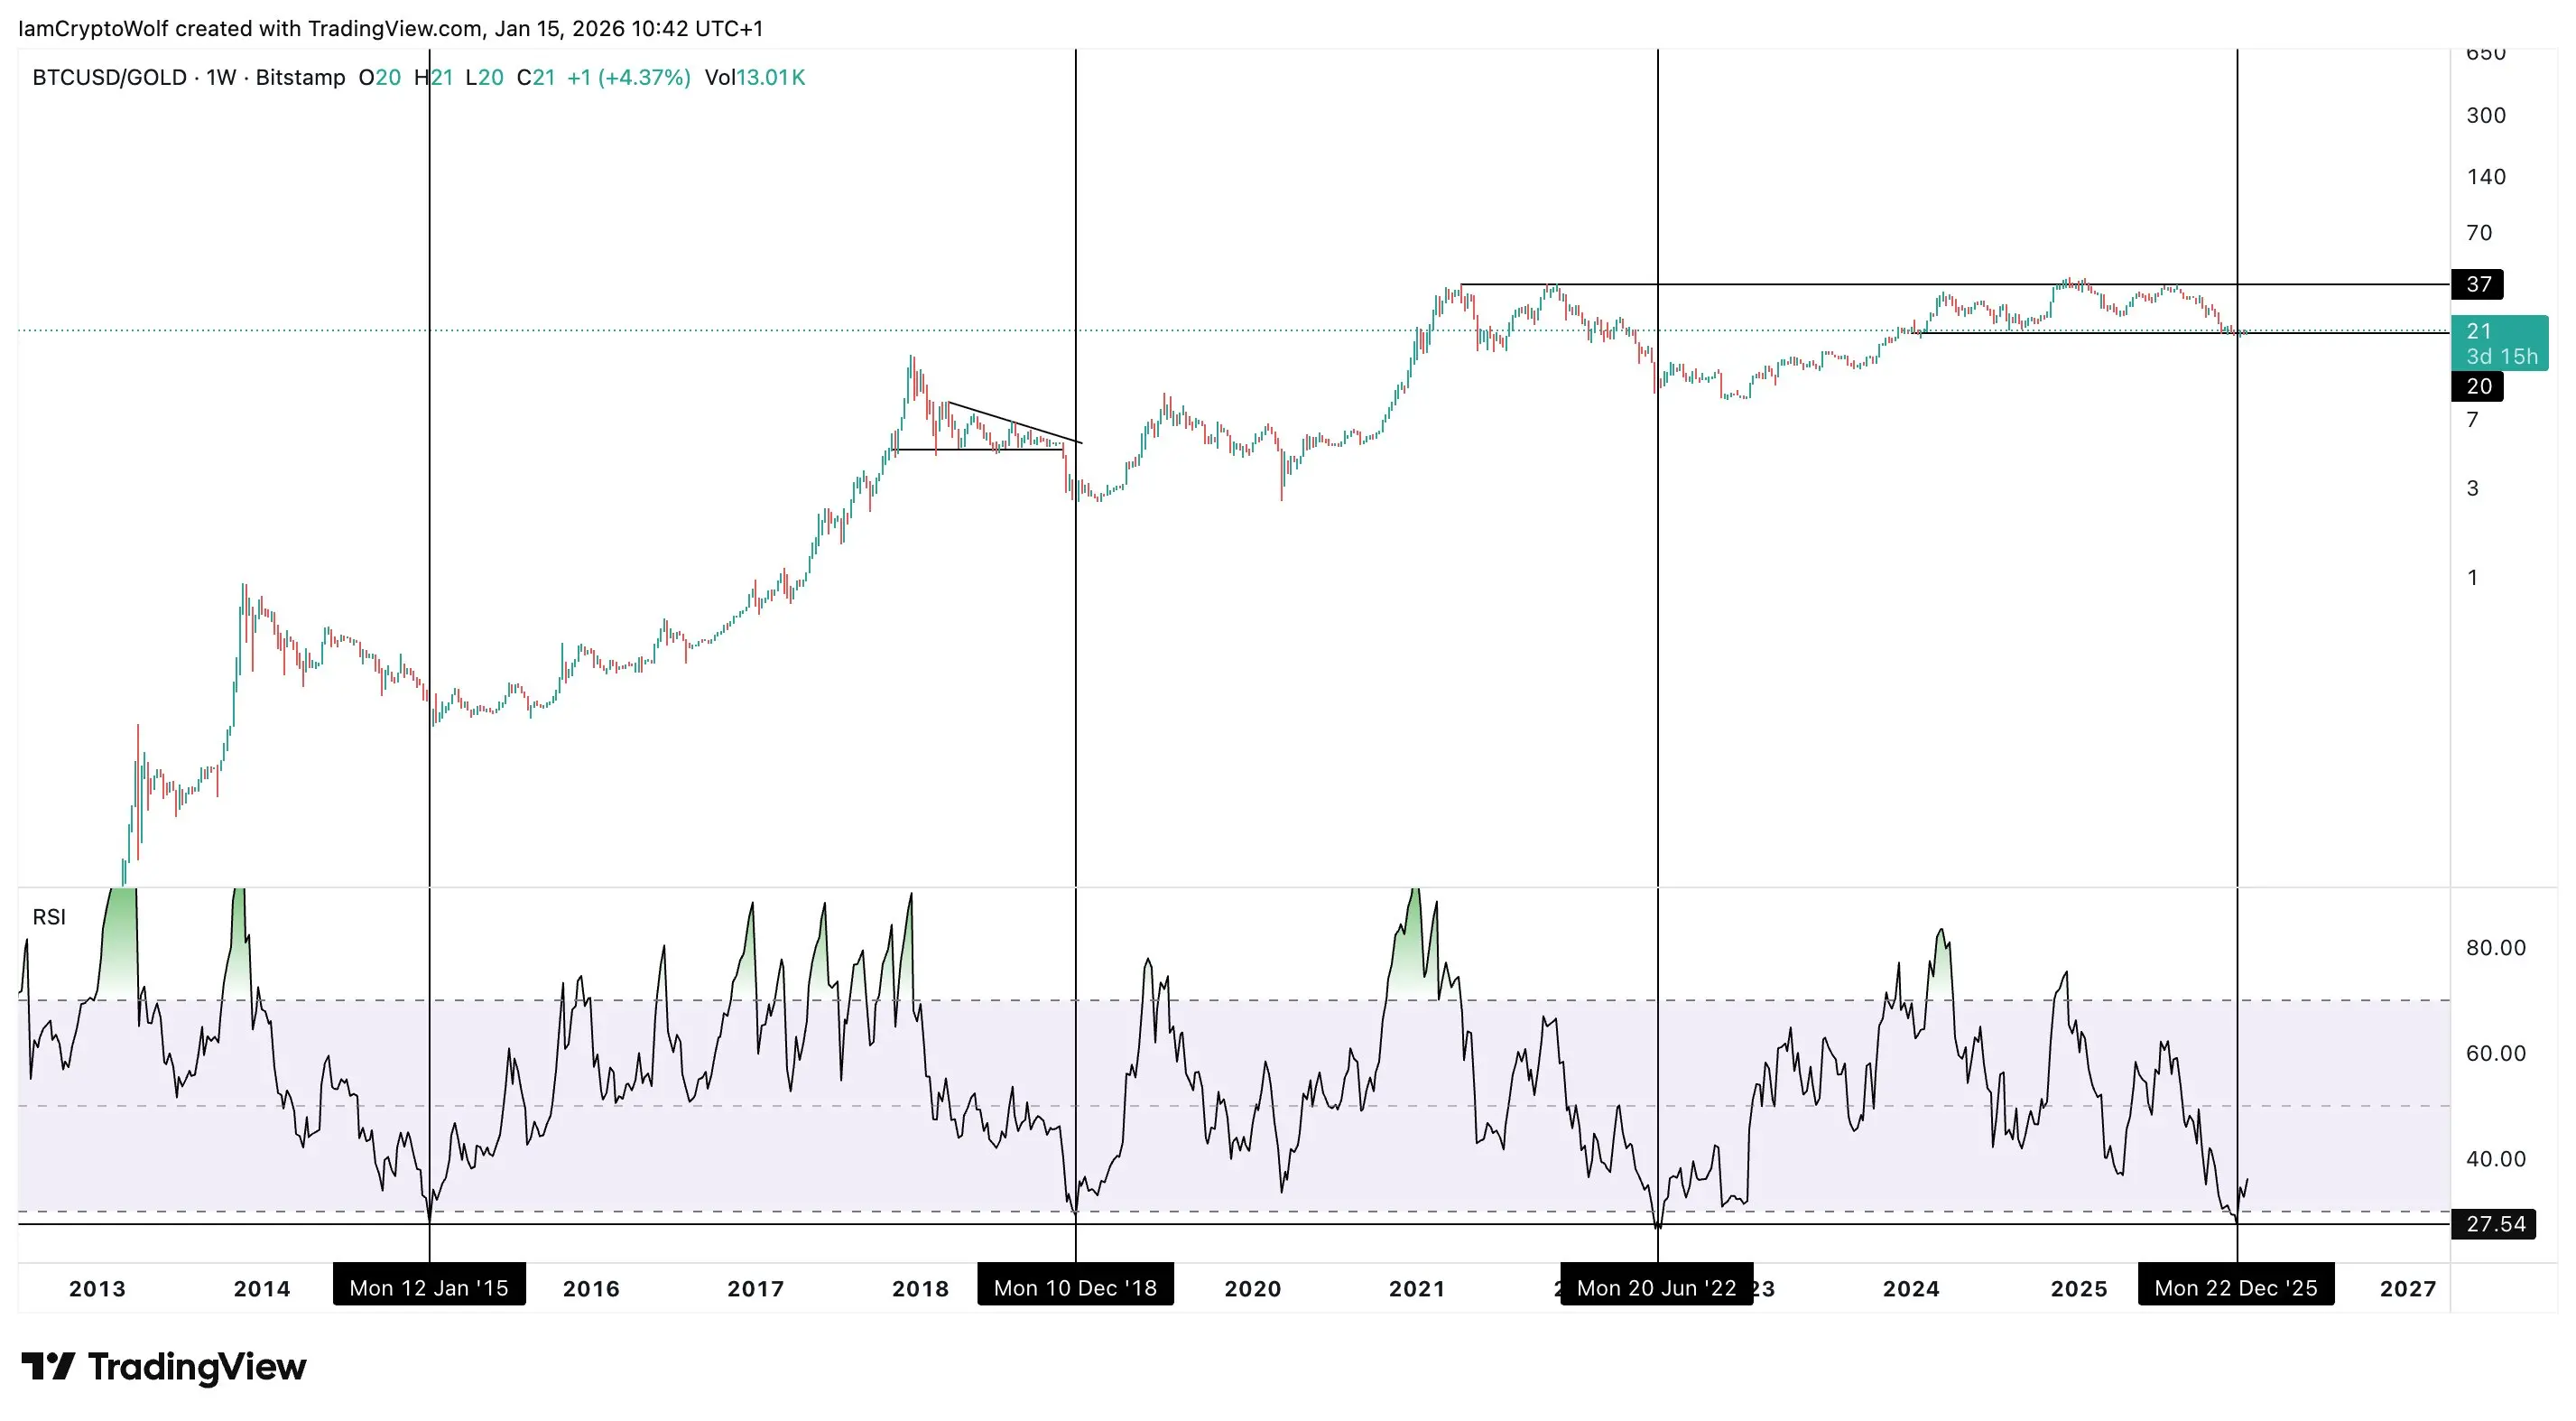
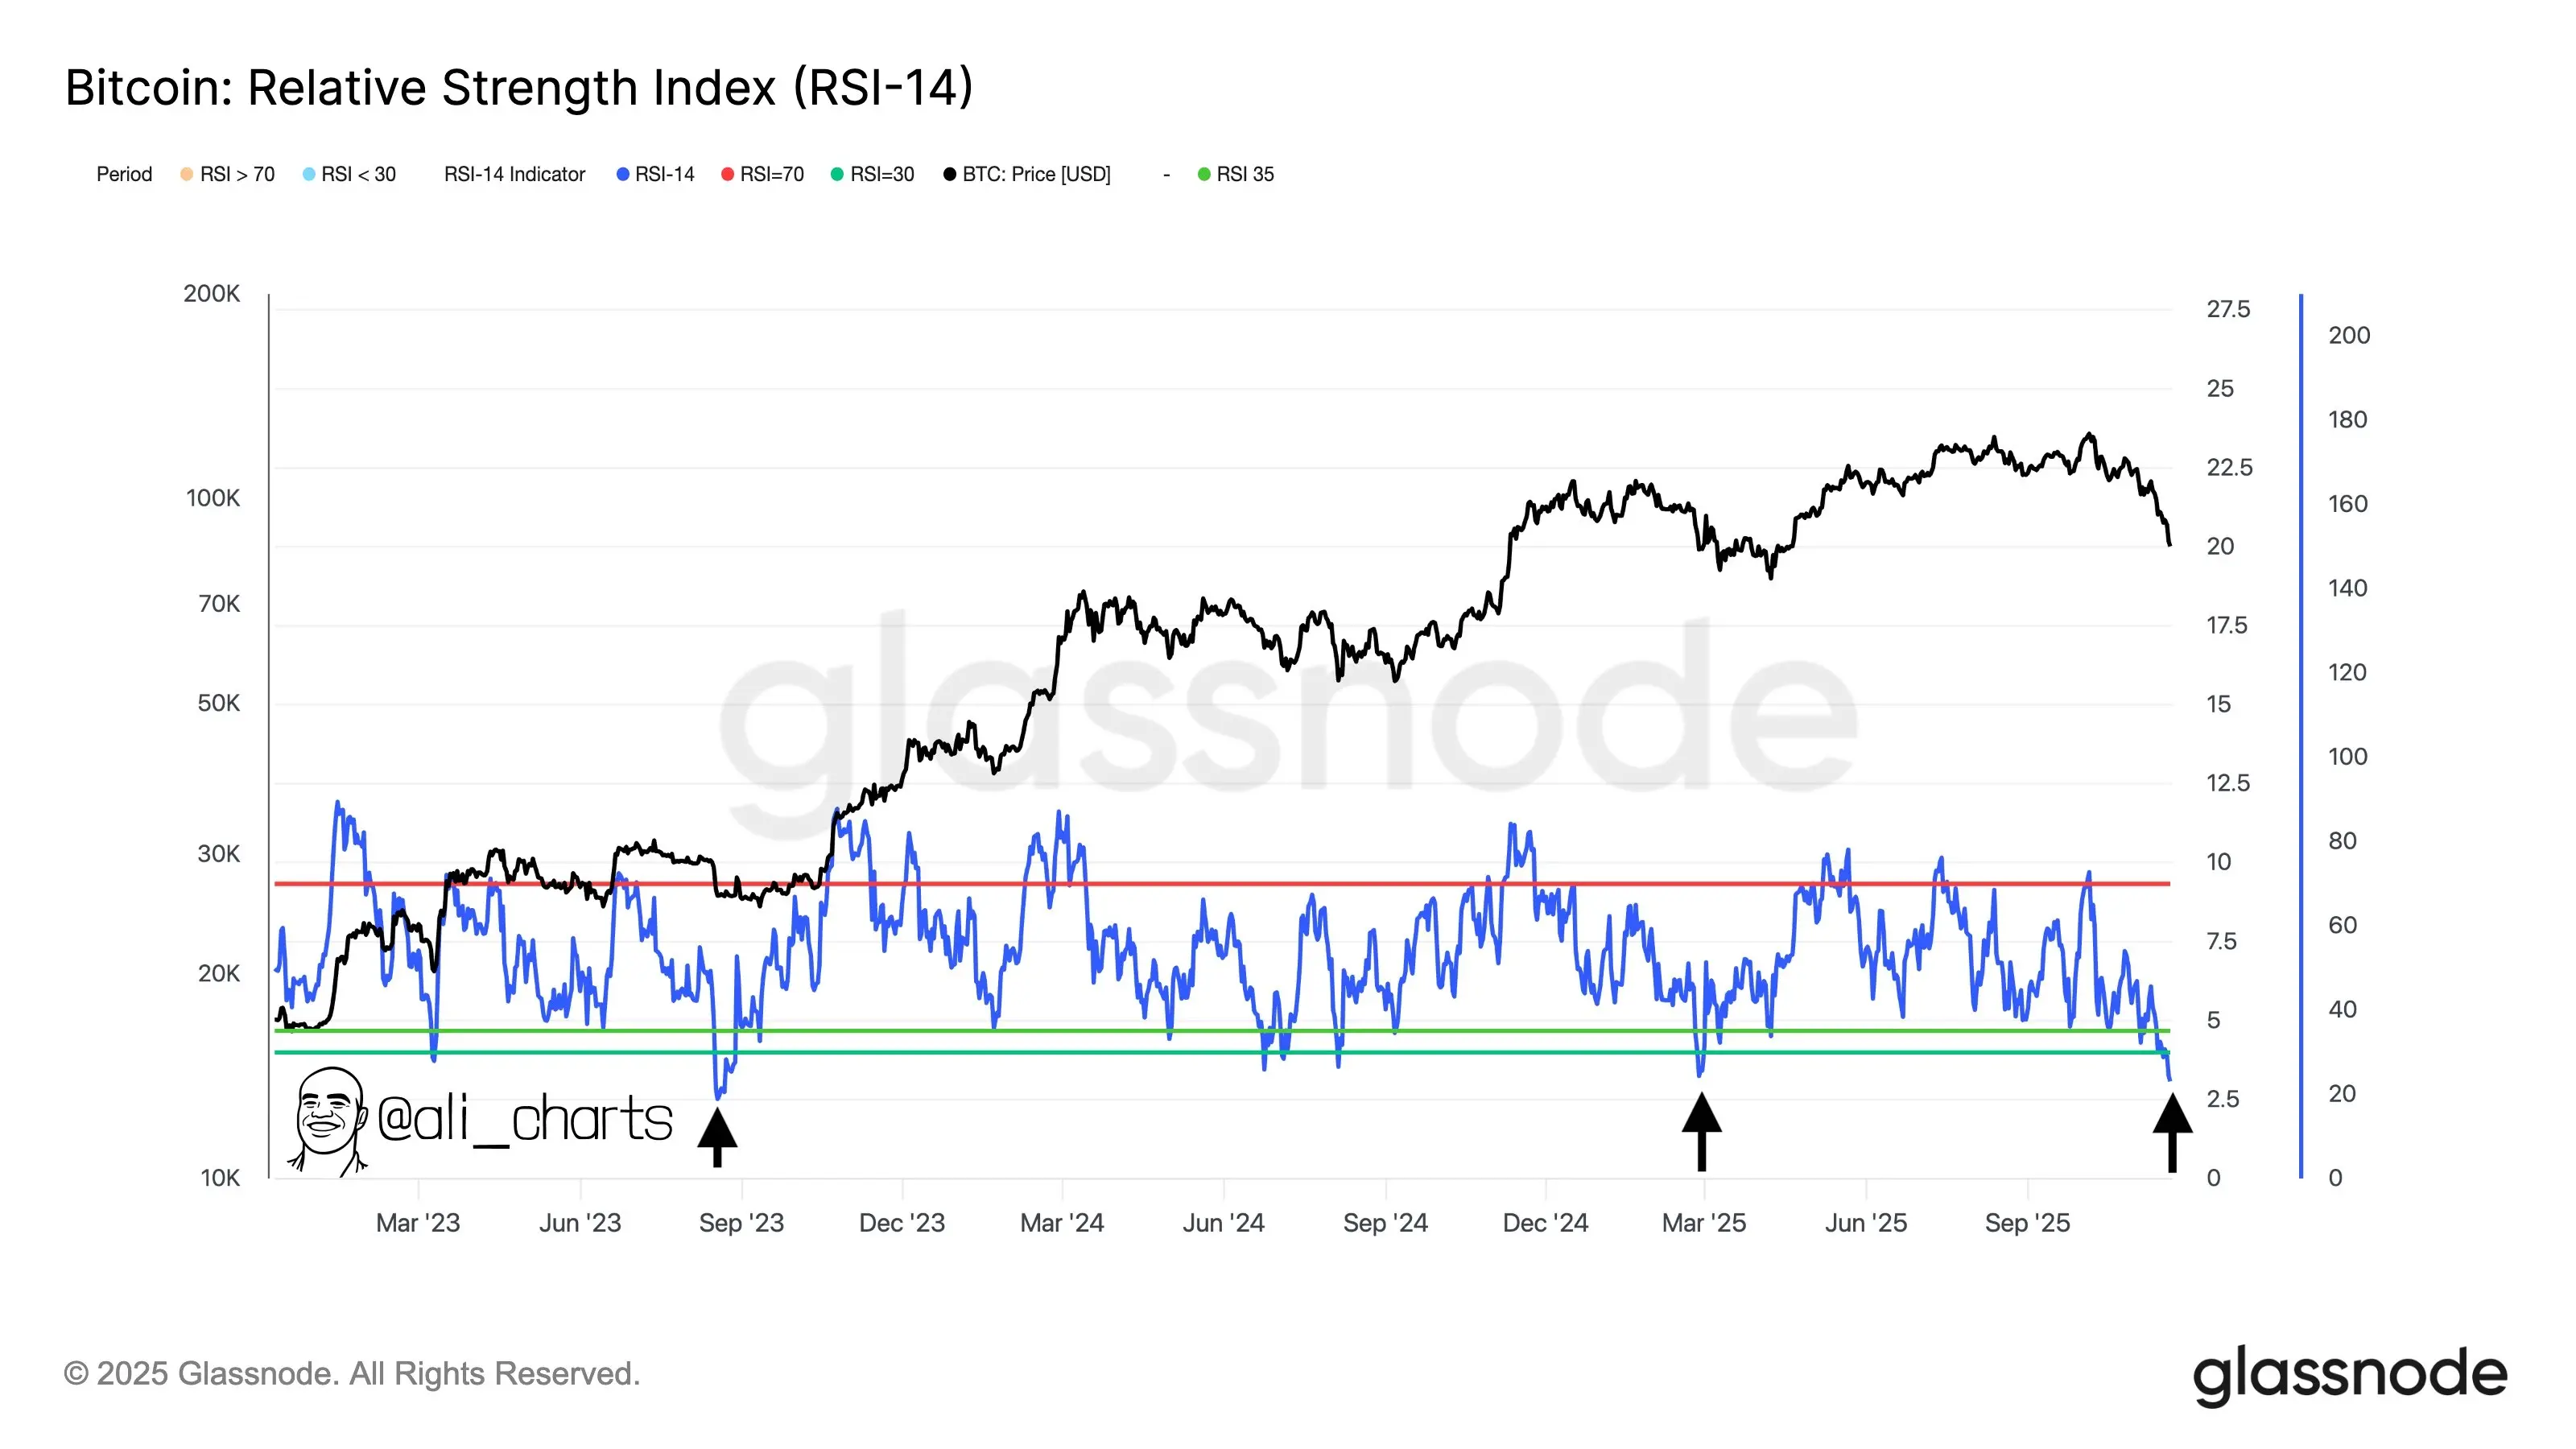
Agent Garrett Jin stated that historically, the ETH/NASDAQ 100 index ratio has often bottomed around 0.11, which coincides with the RSI approaching the 30 "oversold" zone, indicating that ETH is in a bottom range. Looking ahead, the probability of Ethereum outperforming the NASDAQ 100 index in the coming months is increasing, with a target ratio between 0.16 and 0.22, suggesting an upside potential of approximately 50% to 100%.Given the high correlation between Ethereum and the NASDAQ 100 index, significant divergence is unlikely to persist. Mean reversion is inevitable, especially in the broader policy context where the U.S. may restart quantitative easing, directly distribute cash stimulus to households, and where SEC Chairman Gary Gensler is accelerating the migration of U.S. stocks on-chain to Ethereum. Additionally, the weekly chart shows that the relative strength index (RSI) of BTC/NASDAQ 100 index is severely oversold. The current RSI falling below 30 also indicates that Bitcoin is about to enter a strong bull market.Earlier reports indicated that the "BTC OG insider whale," which had been dormant for 8 years, once held over 50,000 BTC. Its operations have repeatedly synchronized with Trump's statements and U.S. policy trends, including a $500 million BTC short position set just hours before the "10.11" crash, yielding nearly $100 million in profit and attracting market attention. BitForex CEO Garrett Jin indicated that this address is associated with his clients. Furthermore, after the "BTC OG insider whale" increased its positions in ETH and SOL yesterday, the current prices have now fallen below the average price of their recent purchases. The current unrealized losses on long positions continue to expand, with total unrealized losses reaching $78.3 million and total position size around $694 million, with only $15.92 million in margin remaining. Its main long positions are: 5x ETH long position: position size $573 million, average price $3,147, unrealized loss $66.77 million (-58%), liquidation price $2,150; 5x BTC long position: position size $85.18 million, average price $91,500, unrealized loss $6.32 million (-37%); 20x SOL long position: position size $31.57 million, average price $135, unrealized loss $5.21 million (-292%).
app_icon
ChainCatcher Building the Web3 world with innovations.